
|
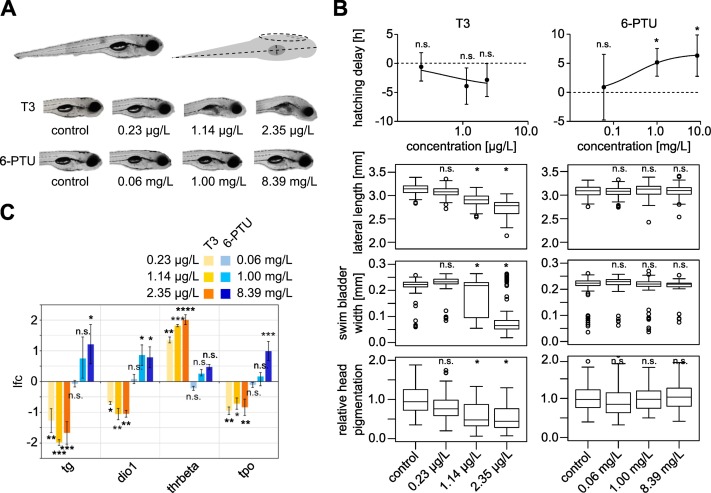
Fig. 1 Fig. 1. Thyroid-related effects of T3 and 6-PTU in zebrafish embryos. (A) Physiological endpoints. Top: lateral view of a zebrafish embryo at 120 hpf (left). Lateral length, swim bladder width and head pigmentation measurements are indicated as dotted lines in the schematic view (right). Bottom: representative images of zebrafish embryos exposed to the indicated concentrations of T3 and 6-PTU as compared to non-treated controls. (B) Analysis of physiological endpoints upon exposure to different concentrations of T3 (left) and 6-PTU (right). Top: relative hatching delay compared to the control in hours. Statistical significance was assessed by a one sample t-test. Middle top: lateral length measurements in mm. Middle bottom: swim bladder width measurements in mm. Bottom: relative head pigmentation measurements. Statistical significance was assessed by William's t-test. N.s. not significant, *p ≤ 0.05. (C) RT-qPCR analysis of thyroid-related genes upon exposure to different concentrations of T3 and 6-PTU. The expression of tg, dio1, thrbeta and tpo upon exposure to the indicated concentrations of T3 and 6-PTU was compared to non-treated controls. Log2-fold change (lfc) as compared to the non-treated controls are plotted. Statistical significance was assessed by one-way Anova followed by a Dunnett's multiple comparison test based on three biological replicates. N.s. not significant, *padj ≤ 0.05, **padj ≤ 0.01, ***padj ≤ 0.001, ****padj ≤ 0.0001.