
|
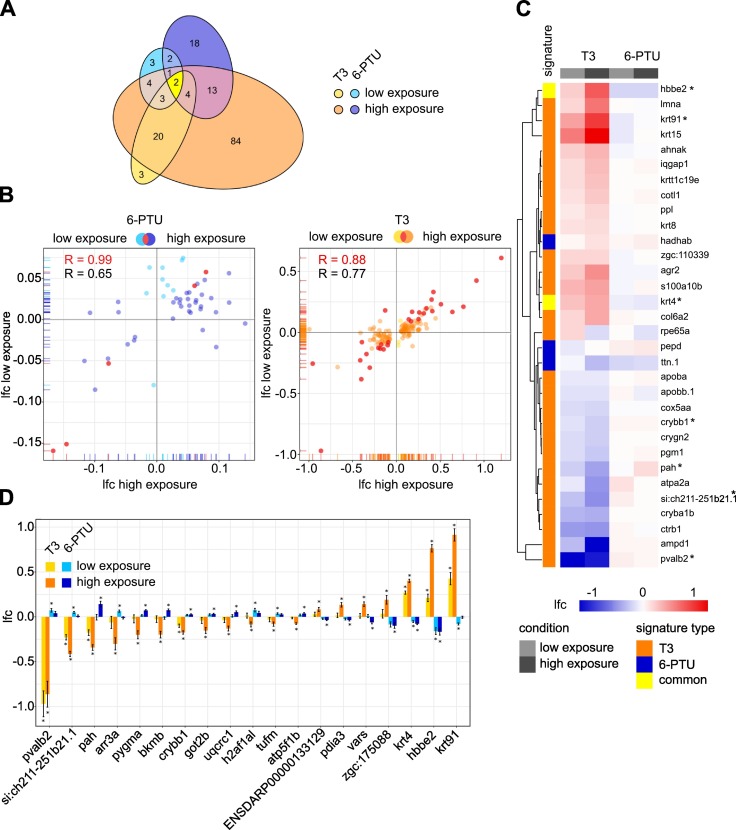
Fig. 3 Fig. 3. Proteome response of zebrafish embryos to sublethal concentrations of T3 and 6-PTU at 96 hpf. (A) Venn diagram showing the statistically significantly (padj ≤ 0.05) differentially expressed proteins of the common set of detected proteins after exposure to 186.6 μg/L (high exposure, orange) and 1.14 μg/L (low exposure, yellow) T3 and to 108.81 mg/L (high exposure, dark blue) and 1.00 mg/L (low exposure, light blue) 6-PTU compared to control groups. Displayed ellipses and intersection sizes correspond to the numbers of proteins. (B) Scatter plots comparing the log2-fold change (lfc) values of differentially expressed proteins observed after low and high exposure to each corresponding substance. The common subset is colored in red. (C) Heatmap containing the proteins of the common subsets indicated in red in the chart (B). The lfc of each protein (rows) is shown for each sample (columns). Red heatmap colors represent an enhanced and blue a suppressed expression of the protein. Proteins are clustered after maximum distance measure with average linkage. The association with a T3 or a 6-PTU signature is indicated in orange and blue, respectively. Proteins associated with both signatures are colored in yellow. (D) Lfc values of potential common marker proteins for distinguishing T3 and 6-PTU responses. All proteins were observed as differentially expressed proteins in either low or high exposure condition after exposure to both substances and showed a counter-regulated response for T3 and 6-PTU. * indicates, in which treatment the corresponding protein was observed as differentially expressed. (For interpretation of the references to colour in this figure legend, the reader is referred to the web version of this article.)