
- Title
-
Interplay of MPP5a with Rab11 synergistically builds epithelial apical polarity and zonula adherens
- Authors
- Hao, Y., Zhou, Y., Yu, Y., Zheng, M., Weng, K., Kou, Z., Liang, J., Zhang, Q., Tang, X., Xu, P., Link, B.A., Yao, K., Zou, J.
- Source
- Full text @ Development
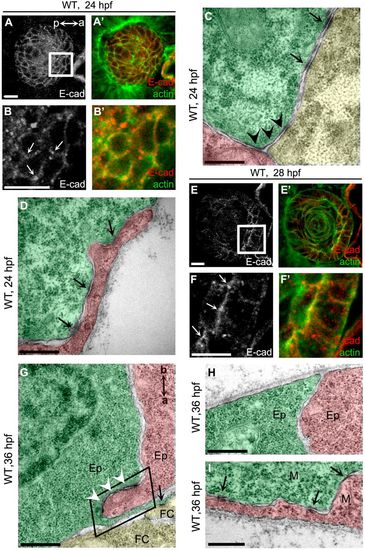
AJs are dynamically remodeled during lens cell state transition. (A) E-cadherin was non-polarly distributed in lens epidermal cells at 24 hpf. (B) Higher magnification of the white boxed region in A. Arrows show the punctuated accumulation of E-cadherin at the vertex points where three neighbor epidermal cells meet. a (anterior) and p (posterior) indicate the lens orientation. (C,D) Tricellular adherens (C, black arrowheads) and lateral punctum adherens (D, arrows) were the major adhesion plaques between lens epidermal cells in WT at 24 hpf. Punctum adherens existed at the lateral (C) and basal (D) regions. (E) E-cadherin was enriched in the apical regions of epithelial cells when epidermal-to-epithelial transition occurred at 28 hpf. (F) Higher magnifications of the white boxed region in E. Arrows show the punctuated accumulation of E-cadherin in the apical regions of epithelial cells. (G) AJs were assembled into zonula adherens at the apical domain between epithelia (white arrowheads). a (apical) and b (basal) indicate the orientation of lens epithelial cells. The black boxed region shows the apical zone between two epithelial cells. (H) Few adhesion plaques were observed in the basal regions between epithelia in WT at 36 hpf. (I) Lateral punctum adherens, but not apical zonula adherens, were observed between mesenchymal cells when epithelial-to-mesenchymal transition occurred. Ep, epithelium; M, mesenchymal cells; FC, fiber cells. Lower magnification TEM images showing the position of C,D and G-I in lens are presented in Fig. S1. Scale bars: 10 μm (A,B,E,F), 400 nm (C,D,G-I). EXPRESSION / LABELING:
|

AJ components fail to accumulate at the apical domains of epithelial cells in nok mutants. (A) Nok protein was not expressed in lens epidermal cells at 24 hpf. a (anterior) and p (posterior) show the lens orientation. (B) Nok started to be expressed in lens epithelial cells at 28 hpf when epidermal-to-epithelial transition occurred. (C,D) Apical enriched β-catenin colocalized with Nok in WT lens epithelial cells at 36 hpf. β-catenin lost its apical enrichment in nok mutants at 36 hpf. C′-C‴ and D′-D‴ are higher magnifications of the white boxed regions in C and D, respectively. (E) Apical zonula adherens disappeared in nok mutants at 36 hpf. a (apical) and b (basal) show the orientation of lens epithelial cells. (F) Quantification of the number of adhesion plaques in lens epithelial cells in WT and nok mutants at 36 hpf. In WT lens, the apical AJs between epithelia (AJs_EE, 1 per epithelium) and the apical AJs between epithelia and fiber cells (AJs_EF, 1.68 per epithelium) were the major types of adhesion plaques. In nok mutants, AJs_EE number significantly decreased (0.45 per epithelium) and the number of other types of adhesion plaques, including the basal AJs between epithelia (BJs_EE), the lateral AJs between epithelia (LJs_EE) and AJs_EF, significantly increased. (G) Quantification of the length of adhesion plaques in epithelial cells in WT and nok mutants at 36 hpf. The length of AJs_EE (0.41±0.03 μm) was significantly longer than LJs_EE (0.15±0.01 μm) and AJs_EF (0.18±0.01 μm) in WT. The length of AJs_EE in nok mutants (0.19±0.02 μm) was significantly reduced and comparable with LJs_EE and AJs_EF (n=49 epithelial cells for WT and 59 for nok mutants). (H,I) Compared with WT (H), a large number of Zl1-immunoreactive negative cells (arrows) accumulated in the inner lens in nok mutants at 28 hpf (I). Scale bars: 10 μm (A-D,H,I), 400 nm (E). ***P<0.001, n.s>0.05. |

The apical localizations of Nok and Rab11 are reciprocally dependent. (A,B) Temporospatial expression pattern of Rab11 in zebrafish lens. Rab11 did not display polarized aggregation in epidermal cells when Crb2a was not detectable at 24 hpf (A), but strongly aggregated in the apical regions in lens epithelial cells at 36 hpf (B). a (anterior) and p (posterior) show the lens orientation. (C) Rab11 lost its apical enrichment in lens epithelial cells in nok mutants. (D,E) eGFP-tagged Rab11a (D) and Rab11 Q70L (E) proteins were enriched in the apical regions in lens epithelial cells in WT. Overexpression of eGFP-Rab11a and eGFP-Rab11 Q70L did not significantly affect the apical enrichment of Nok. (F,G) eGFP-tagged Rab11a (F) and Rab11 Q70L (G) proteins were distributed at the lateral and basal regions in lens epithelial cells in nok mutants. (H-K) The apical localization of Crb2a in lens epithelial cells was partially disrupted in rab11a (H) or rab11ba mutants (I) and completely disrupted in rab11a/rab11ba dKO mutants (J). Similarly, the apical localization of Nok was lost in rab11a/rab11ba dKO mutants (K). (L,M) Overexpression of eGFP-2A-Rab11a (L) or eGFP-2A-Rab11a S25N (M) following mRNA injection. Overexpression of Rab11a S25N (M), but not Rab11a (L), impeded the apical aggregation of Nok. Low levels of Nok were observed in mesenchymal cells overexpressing eGFP-2A-Rab11a S25N in the posterior lens (M, white triangles). (N,O) eGFP-Rab11a S25N is evenly spread to apical, lateral and basal regions in WT lens epithelial cells. Lower level overexpression of eGFP-Rab11a S25N induced the lateral and basal distribution of Nok (N), and higher level of eGFP-Rab11a S25N impeded the apical aggregation of Nok (O). Low levels of Nok were observed in mesenchymal cells overexpressing eGFP-Rab11a S25N in the posterior lens (white triangles). (P) Overexpression of eGFP-Rab5 S36N did not significantly affect the apical enrichment of Nok in WT lens epithelial cells. Low levels of Nok (white triangles) were observed in mesenchymal cells overexpressing eGFP-Rab5 S36N in the posterior lens. The embryos used for B-P were fixed at 36 hpf. Arrows show the apical regions of lens epithelial cells. Broken arrows show the basal regions of lens epithelial cells. White triangles show fiber cells in the posterior lens. Plasmids pTol2-EF1::eGFP-Rab11a, pTol2-EF1::eGFP-Rab11a S25N, pTol2-EF1::eGFP-Rab11a Q70L or pTol2-EF1::eGFP-Rab5 S36N were used for the sporadic overexpression of eGFP-tagged Rab proteins shown in Fig. 3D-G,N-P. Scale bars: 10 μm. |
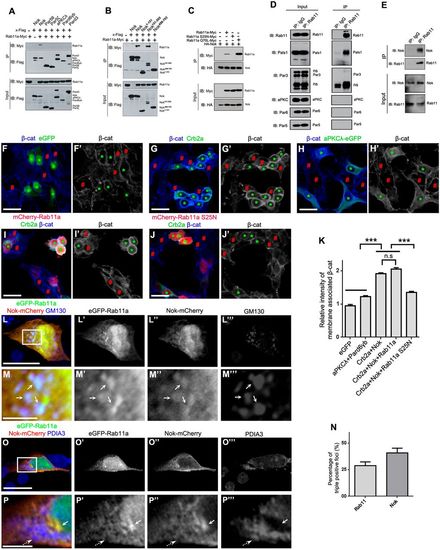
Nok interplays with Rab11 to promote membrane association of β-catenin in human cultured cells. (A) Nok, but not the other polarity proteins examined, including Par5θ, Par5ζ, aPKCλ, Pard6γb and Pard3, interacted with Rab11a. (B) The L27-SH3-PDZ domain of Nok (Nok151-505) interacted with Rab11a. (C) The dominant negative Rab11a (S25N) did not interact with Nok, although the constitutively active Rab11a (Q70L) had a higher affinity for Nok than wild-type Rab11a. (D) Co-immunoprecipitation verified the endogenous complex between Rab11 and Nok in MDCK cells, but not the other tested proteins. (E) Co-immunoprecipitation using zebrafish eye extracts verified the endogenous complex between Nok and Rab11 in zebrafish. (F-H) Co-expression of Crb2a and Nok (G), but not co-expression of aPKCλ and Pard6γb (H) or expression of eGFP (F) promoted the membrane association of β-catenin in HEK293T cells. Green asterisks indicate transfection-positive cells and red # symbols indicate transfection-negative neighbor cells. (I,J) The expression of Rab11a S25N (J), but not Rab11a (I) impeded the membrane association of β-catenin induced by co-expression of Crb2a and Nok in HEK293T cells. (K) Quantification of fluorescence intensity of membrane-associated β-catenin shown in F-J (n>60 cells). Relative intensity was calculated by dividing the intensity in cells marked by an * by that in cells marked by a # symbol. (L-P) eGFP-Rab11a was colocalized with Nok-mCherry in Golgi (L,M; labeled by GM130), but not in endoplasmic reticulum (O,P; labeled by PDIA3) in MDCK cells. M and P are higher magnifications of the white boxed regions in L and O, respectively. Arrows show the aggregation of eGFP-Rab11a and Nok-mCherry, broken arrows show endoplasmic reticulum. (N) Quantification of the percentage of triple positive foci in Rab11a-positive foci and Nok-positive foci shown in L (n>60 cells). Scale bars: 20 μm (F-J), 10 μm (L,O), 2.5 μm (M,P). ***P<0.001, n.s>0.05. |

Rab11 determines the localization and assembly of AJs. (A-F) The distribution of β-catenin in WT (A), rab11a (B), rab11ba (C), rab11a/rab11ba dKO (D), eGFP-2A-Rab11a overexpressed (E) and eGFP-2A-Rab11a S25N overexpressed (F) embryos at 36 hpf. a (anterior) and p (posterior) in A show the lens orientation. Arrows (E,F) show that eGFP-2A-Rab11a S25N, but not eGFP-2A-Rab11a, impeded the apical enrichment of β-catenin. (G) Scheme showing locations of apical and basal spots for relative fluorescence intensity measurements. (H) Quantification of apical/basal relative intensity of β-catenin shown in A-F (n=20 lenses from 10 embryos). (I,J) Both dKO of rab11a/rab11ba (I) and overexpression of Rab11a S25N (J) disrupted the AJs_EE zonula adherens at 36 hpf. Arrow shows AJs_EF punctum adherens. a (apical) and b (basal) show the orientation of lens epithelial cells. (K) Overexpression of Rab11a S25N or rab11a/rab11ba dKO significantly impeded the formation of AJs_EE. The number of AJs_EF also significantly decreased in rab11a/rab11ba dKO mutants (n=56 epithelial cells for rab11a/rab11ba dKO mutants, and 73 for Rab11a S25N overexpressed embryos). (L) The length of AJs_EE in Rab11a S25N overexpressed or rab11a/rab11ba dKO mutant lens (0.19±0.02 μm) was comparable with that in nok mutants and significantly shorter than that in WT. (M) Although the number of LJs_EE significantly increased in Rab11a S25N overexpressed or rab11a/rab11ba dKO mutant lens (0.15±0.01 μm), the length of LJs_EE was comparable with that in WT and nok mutants. Ep, epithelium; FC, fiber cells. Scale bars: 10 μm (A-F), 400 nm (I,J). *P<0.05, **P<0.01, ***P<0.001, n.s>0.05. PHENOTYPE:
|
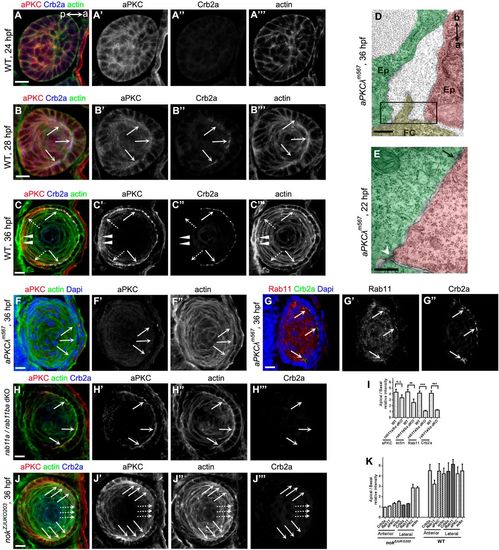
aPKC organizes cytoskeleton to promote AJ remodeling, but apical localization of aPKC does not require Rab11. (A-C) Temporospatial expression pattern of aPKC in zebrafish lens. (A) aPKC displays non-polarized distribution in lens epidermal cells when Crb2a was not expressed at 24 hpf. (B) Coupling with Crb2a expression in epithelia, aPKC was accumulated to the apical domains at 28 hpf. (C) aPKC was restricted at the apical domains and colocalized with Crb2a in epithelial cells at 36 hpf. In contrast to Crb2a, aPKC was also expressed in lens mesenchymal cells (broken arrows) and primary fiber cells (arrowheads). Arrows show the apical aggregation of aPKC, Crb2a and actin in lens epithelial cells. Broken arrows show the lens mesenchymal cells. Arrowheads show the primary fiber cells. a (anterior) and p (posterior) in panel A show the lens orientation. (D) Apical zonula adherens disappeared in lens epithelial cells in aPKCλ mutants at 36 hpf. a (apical) and b (basal) show the orientation of lens epithelial cells. The black boxed region in D shows the apical zone between two epithelial cells. (E) Tricellular adherens (white arrowhead) and lateral punctum adherens (black arrow) between lens epidermal cells in aPKCλ mutants at 22 hpf. (F) In aPKCλ mutants, aPKC staining had disappeared (F), actin lost its apical enrichment. Arrows show the apical regions of lens epithelial cells. (G) In aPKCλ mutants, Crb2a and Rab11 lost their apical distribution in most epithelial cells at 36 hpf. Arrows show the apical colocalization of Crb2a and Rab11. (H) In rab11a/rab11ba dKO mutants, Crb2a lost its apical aggregation at 36 hpf. In contrast, aPKC and actin were still enriched at the apical domains in lens epithelial cells. Arrows show the apical regions of lens epithelial cells. (I) Quantification of apical/basal relative fluorescence intensity of aPKC, actin, Crb2a and Rab11 in WT and rab11a/rab11ba dKO mutants shown in H. aPKC displayed normal apical enrichment in rab11a/rab11ba dKO mutant lens epithelial cells; however, apical enrichment of actin, Crb2a and Rab11 was significantly decreased although actin reduction was mild (n=20 lenses from 10 embryos). (J) The apical localization of aPKC and actin displayed a heterogeneity in different lens epithelial cells in nok mutants at 36 hpf. Broken arrows show that aPKC and actin lost their apical enrichment in the anterior epithelial cells. Arrows show that aPKC and actin were still enriched in the apical regions in lateral epithelial cells. (K) Quantification of apical/basal relative fluorescence intensity of aPKC, actin, Crb2a and Rab11 in nok mutants shown in J and Fig. 3C. The apical enrichment of actin was associated with aPKC, whereas the apical enrichment of Rab11 was associated with Crb2a. Crb2a and aPKC showed concurrent apical localization in anterior epithelia, but not in lateral epithelial cells (n=20 lenses from 10 embryos). Scale bars: 10 μm (A-C,F-I), 400 nm (D,E). **P<0.01, ***P<0.001. |