
Fig. 4
- ID
- ZDB-FIG-210114-21
- Publication
- Hao et al., 2020 - Interplay of MPP5a with Rab11 synergistically builds epithelial apical polarity and zonula adherens
- Other Figures
- All Figure Page
- Back to All Figure Page
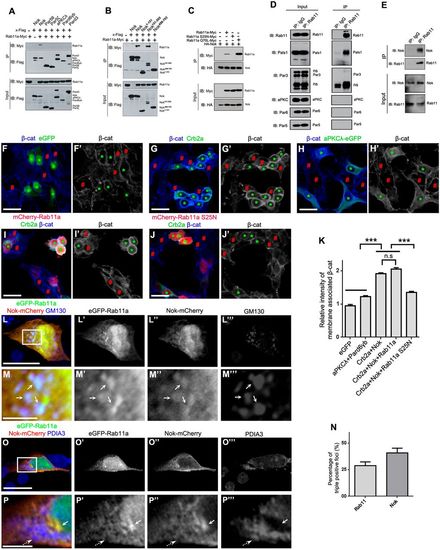
Nok interplays with Rab11 to promote membrane association of β-catenin in human cultured cells. (A) Nok, but not the other polarity proteins examined, including Par5θ, Par5ζ, aPKCλ, Pard6γb and Pard3, interacted with Rab11a. (B) The L27-SH3-PDZ domain of Nok (Nok151-505) interacted with Rab11a. (C) The dominant negative Rab11a (S25N) did not interact with Nok, although the constitutively active Rab11a (Q70L) had a higher affinity for Nok than wild-type Rab11a. (D) Co-immunoprecipitation verified the endogenous complex between Rab11 and Nok in MDCK cells, but not the other tested proteins. (E) Co-immunoprecipitation using zebrafish eye extracts verified the endogenous complex between Nok and Rab11 in zebrafish. (F-H) Co-expression of Crb2a and Nok (G), but not co-expression of aPKCλ and Pard6γb (H) or expression of eGFP (F) promoted the membrane association of β-catenin in HEK293T cells. Green asterisks indicate transfection-positive cells and red # symbols indicate transfection-negative neighbor cells. (I,J) The expression of Rab11a S25N (J), but not Rab11a (I) impeded the membrane association of β-catenin induced by co-expression of Crb2a and Nok in HEK293T cells. (K) Quantification of fluorescence intensity of membrane-associated β-catenin shown in F-J (n>60 cells). Relative intensity was calculated by dividing the intensity in cells marked by an * by that in cells marked by a # symbol. (L-P) eGFP-Rab11a was colocalized with Nok-mCherry in Golgi (L,M; labeled by GM130), but not in endoplasmic reticulum (O,P; labeled by PDIA3) in MDCK cells. M and P are higher magnifications of the white boxed regions in L and O, respectively. Arrows show the aggregation of eGFP-Rab11a and Nok-mCherry, broken arrows show endoplasmic reticulum. (N) Quantification of the percentage of triple positive foci in Rab11a-positive foci and Nok-positive foci shown in L (n>60 cells). Scale bars: 20 μm (F-J), 10 μm (L,O), 2.5 μm (M,P). ***P<0.001, n.s>0.05. |