
- Title
-
Integration of anatomy ontology data with protein-protein interaction networks improves the candidate gene prediction accuracy for anatomical entities
- Authors
- Fernando, P.C., Mabee, P.M., Zeng, E.
- Source
- Full text @ BMC Bioinformatics
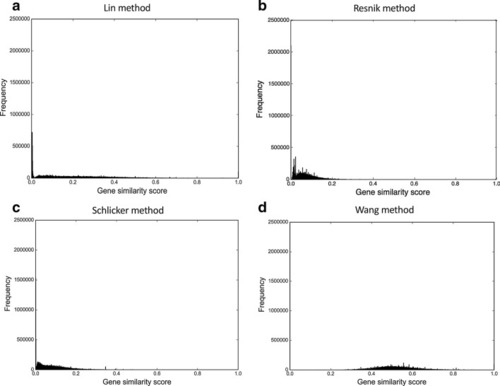
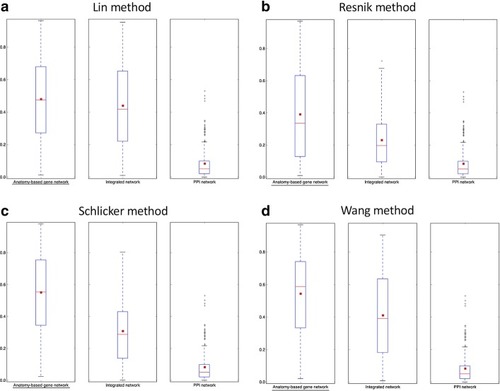
The gene similarity score distributions for the zebrafish unfiltered anatomy-based gene networks. The networks were constructed by |
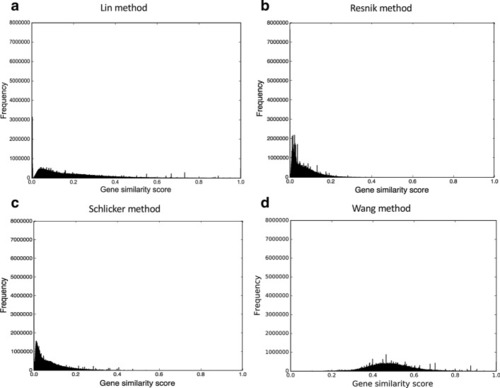
The gene similarity score distributions for the mouse unfiltered anatomy-based gene networks. The networks were constructed by |
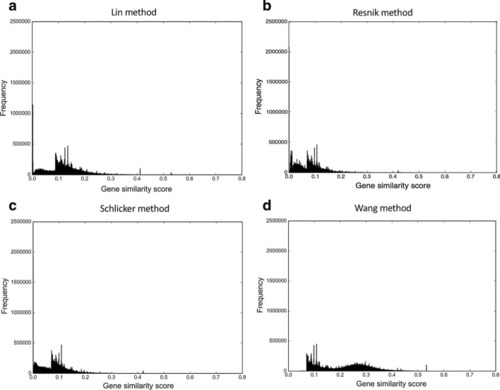
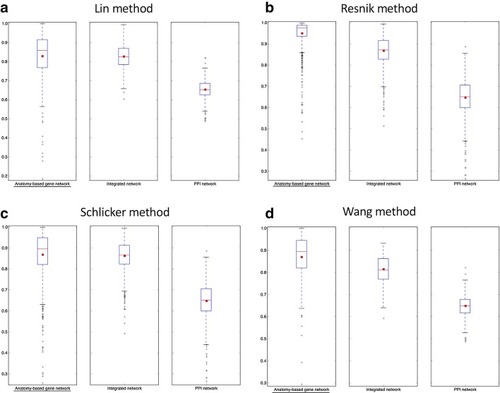
The gene similarity score distributions for the zebrafish unfiltered integrated networks. The networks were constructed by |
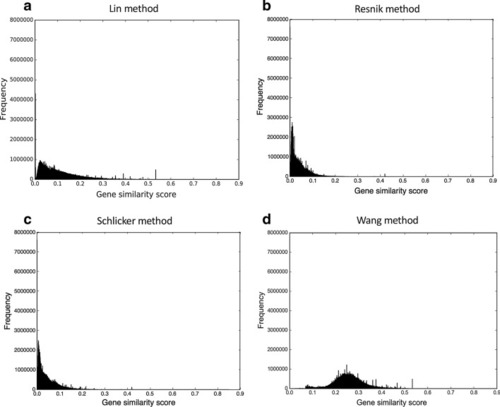
The gene similarity score distributions for the mouse unfiltered integrated networks. The networks were constructed by |

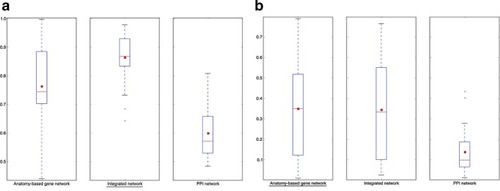
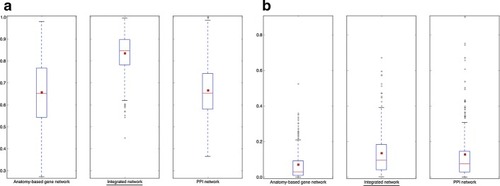
The boxplot comparisons of the AUC distributions of ROC curves for zebrafish networks. The distributions for filtered PPI networks are compared with filtered anatomy-based gene networks and integrated networks constructed by |
The boxplot comparisons of the AUC distributions of precision-recall curves for zebrafish networks. The distributions for filtered PPI networks are compared with filtered anatomy-based gene networks and integrated networks constructed by |
The boxplot comparisons of the AUC distributions of ROC curves for mouse networks. The distributions for filtered PPI networks are compared with filtered anatomy-based gene networks and integrated networks constructed by |

The boxplot comparisons of the AUC distributions of precision-recall curves for mouse networks. The distributions for filtered PPI networks are compared with filtered anatomy-based gene networks and integrated networks constructed by |
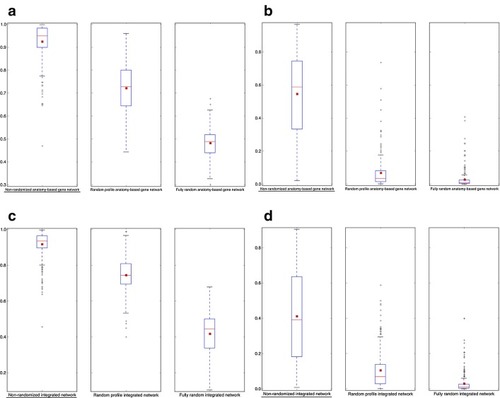
The network performance comparisons between non-randomized and randomized networks for zebrafish. The boxplot comparisons of the AUC distributions for |
The network performance comparisons for zebrafish networks when evaluated by randomly removed 30 anatomical entities. The boxplot comparisons of the AUC distributions for |
The network performance comparisons for zebrafish networks when evaluated by Gene Ontology-Biological Process (GO-BP) entities. The boxplot comparisons of the AUC distributions of |
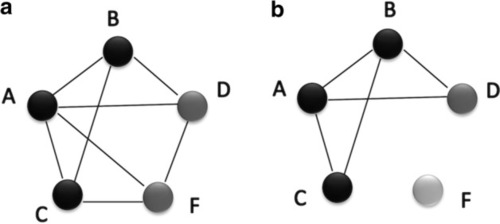
A hypothetical representation showing how the network integration filters false positive interactions. This scenario compares candidate gene predictions between a |