
Image
|
Figure Caption
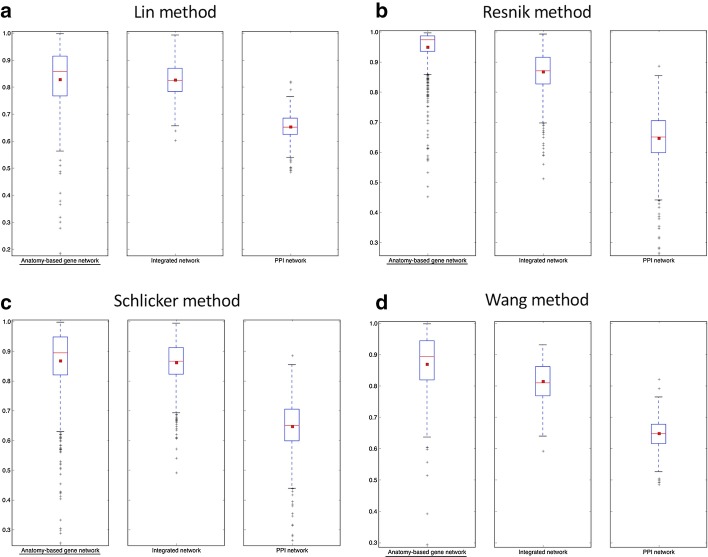
Fig. 7
The boxplot comparisons of the AUC distributions of ROC curves for mouse networks. The distributions for filtered PPI networks are compared with filtered anatomy-based gene networks and integrated networks constructed by
Acknowledgments
This image is the copyrighted work of the attributed author or publisher, and
ZFIN has permission only to display this image to its users.
Additional permissions should be obtained from the applicable author or publisher of the image.
Full text @ BMC Bioinformatics