IMAGE

Fig. 12

ID
ZDB-IMAGE-201012-21
Source
Figures for Fernando et al., 2020
Image
Figure Caption

Fig. 12

A hypothetical representation showing how the network integration filters false positive interactions. This scenario compares candidate gene predictions between a
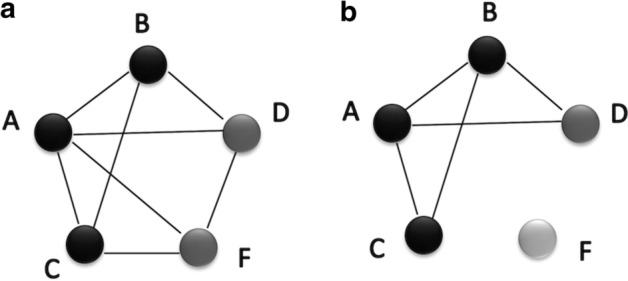
 a PPI network and an b anatomy-based gene network. The nodes A, B, and C (colored in black) in both networks represent three genes known to be associated with a certain anatomical entity denoted as entity 1. In the PPI network (a), genes D and F are predicted to be associated with entity 1 because genes D and F interact with genes A, B, and C that are known to be associated with the entity 1. In contrast, the anatomy-based gene network (b) only predicts D as a potential candidate for entity 1 because the gene F does not have any interaction with other genes annotated with entity 1. The absence of interactions of gene F in gene network (b) can be due to two reasons: (1) it is not annotated with any anatomical entities, (2) it is not annotated with entities that are similar to the anatomy entities associated with genes A, B, or C. The anatomy-based gene network (b) is built entirely on anatomy ontology information, thus it provides a different interaction structure. Hypothetically, the gene F could have formed false positive interactions in the PPI network, and the integrative use of the anatomy-based gene network may reduce the false positives by filtering them

Acknowledgments
This image is the copyrighted work of the attributed author or publisher, and ZFIN has permission only to display this image to its users. Additional permissions should be obtained from the applicable author or publisher of the image. Full text @ BMC Bioinformatics