
Image
|
Figure Caption
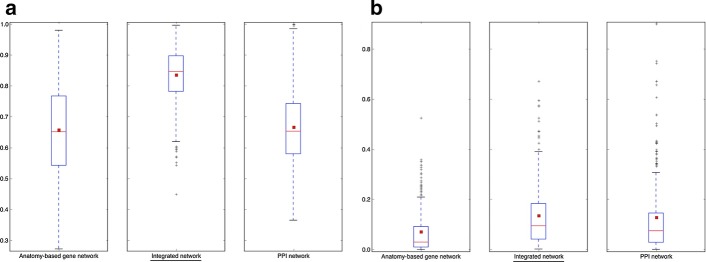
Fig. 11
The network performance comparisons for zebrafish networks when evaluated by Gene Ontology-Biological Process (GO-BP) entities. The boxplot comparisons of the AUC distributions of
Acknowledgments
This image is the copyrighted work of the attributed author or publisher, and
ZFIN has permission only to display this image to its users.
Additional permissions should be obtained from the applicable author or publisher of the image.
Full text @ BMC Bioinformatics