IMAGE

Fig. 10

ID
ZDB-IMAGE-201012-19
Source
Figures for Fernando et al., 2020
Image
Figure Caption

Fig. 10

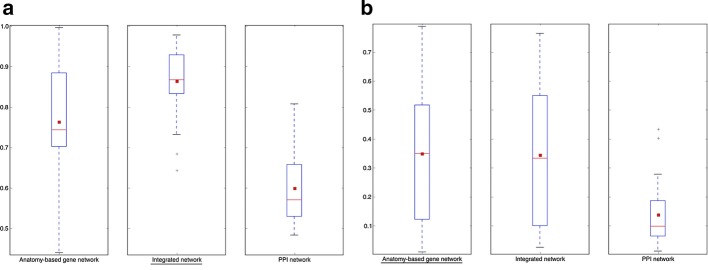
The network performance comparisons for zebrafish networks when evaluated by randomly removed 30 anatomical entities. The boxplot comparisons of the AUC distributions for a ROC and b precision–recall curves for the filtered integrated network, PPI network, and anatomy-based gene network for the Wang method for zebrafish. The integrated network and the anatomy-based gene network were generated using the zebrafish anatomy profiles after randomly removing 30 anatomical entities, which had at least 10 gene annotations. The same 30 entities were used for the evaluation. In the boxplots, the red line and the square represent the median and mean, respectively, and the name of the best performing network is underlined

Acknowledgments
This image is the copyrighted work of the attributed author or publisher, and ZFIN has permission only to display this image to its users. Additional permissions should be obtained from the applicable author or publisher of the image. Full text @ BMC Bioinformatics