FIGURE SUMMARY
Title

Mutations in the KIF21B kinesin gene cause neurodevelopmental disorders through imbalanced canonical motor activity

Authors
Asselin, L., Rivera Alvarez, J., Heide, S., Bonnet, C.S., Tilly, P., Vitet, H., Weber, C., Bacino, C.A., Baranaño, K., Chassevent, A., Dameron, A., Faivre, L., Hanchard, N.A., Mahida, S., McWalter, K., Mignot, C., Nava, C., Rastetter, A., Streff, H., Thauvin-Robinet, C., Weiss, M.M., Zapata, G., Zwijnenburg, P.J.G., Saudou, F., Depienne, C., Golzio, C., Héron, D., Godin, J.D.
Source
Full text @ Nat. Commun.

Patients with <italic>KIF21B</italic> variants.

ad Pedigrees of patients with identified KIF21B variants. eg Sagittal brain section of patient’s MRI showing a complete agenesis of the corpus callosum in patient 1 (e, red arrow) and microcephaly in patient 2 (f). h Schematic representation of the human KIF21B (hKIF21B) protein indicating the different domains (motor domain, ATP binding site, coiled-coil domain (CC) 1 and 2, regulatory coiled-coil domain (rCC) and WD40 domain) and the position of the mutated amino acids for patient 1 (p.Ile678Leu), 2 (p.Gln313Lys), 3 (p.Ala1001Thr) and 4 (p.Asn988SerfsX4). T96N substitution that abolishes KIF21B mobility is also depicted.

Kif21b expression in mouse developing cortex.

a RT-qPCR analyses showing expression of Kif21b transcripts in mouse cortices at different embryonic stages (from E12.5 to E18.5) (n = 4 brains per stage). b Western blot analyses of mouse cortical extracts showing similar expression of Kif21b protein from E14.5 to P2 (n = 3 brains per stage). a, b Data are represented as means ± S.E.M. Significance was calculated by one-way ANOVA (Bonferroni’s multiple comparisons test), ns non-significant; **P < 0.005; ***P < 0.001. c, d E14.5 mouse forebrain coronal sections immunolabelled for Kif21b (magenta) and β-III-tubulin (neuronal marker, green) and counterstained with DAPI (blue) showing that Kif21b expression is restricted to post mitotic neurons. e, f Left panel: schematic representation of a 2-compartments microfluidic chamber. Cortical neurons (in cyan) plated in the upper chamber (gray) grow their axons through 450-μm-long microchannels. The length of the microchannels allows axons but not dendrites to reach the lower chamber. Right panel: immunolabeling of Kif21b (magenta) and tau (axonal marker, cyan) on mouse primary cortical neurons at DIV5 in microdevices showing expression of Kif21b in axons (e) with an enrichment in growth cones (f). CP cortical plate, IZ intermediate zone, SVZ subventricular zone, VZ ventricular zone. Scale bars, (c) 250 µm and (df) 100 µm, magnifications (e, f) 20 µm. Source data are provided in the Source Data file.

Expression of h<italic>KIF21B</italic> missense variants induces abnormal neuronal migration.

a, c Coronal sections of E18.5 (a) or P2 (c) mouse cortices electroporated at E14.5 with NeuroD-IRES-GFP empty vector (1 µg/µL) or WT, p.Gln313Lys, p.Ile678Leu or p.Ala1001Thr NeuroD-hKIF21B or co-expressing WT-hKIF21B together with mutated hKIF21B constructs (ratio 1:1). GFP-positive electroporated cells are depicted in green. Nuclei are stained with DAPI. b, d Analysis (means ± S.E.M.) of the percentage of electroporated GFP-cells in different regions (Up CP: upper cortical plate, Lo CP: lower cortical plate, IZ: intermediate zone, SVZ: subventricular zone) showing effect of expressing hKIF21B variants. Data were analyzed by two-way ANOVA (Bonferroni’s multiple comparisons test). Number of embryos analyzed: b Empty vector, n = 6; WT, n = 13; p.Gln313Lys, n = 6; p.Ile678Leu, n = 11; p.Ala1001Thr, n = 8. Rescue experiments: n = 6 for each condition. d Empty vector, n = 3; WT, n = 4; p.Gln313Lys, n = 6; p.Ile678Leu, n = 6; p.Ala1001Thr, n = 4. ns non-significant; *P < 0.05; **P < 0.005; ***P < 0.001; ****P < 0.0001. e Cux1-immunolabeling (gray) of P2 coronal sections of mouse brains electroporated at E14.5 with the WT or p.Ile678Leu NeuroD-hKIF21B constructs showing no specification defects of arrested neurons (green). Scale bars (a, c, e) 50 μm. Source data are provided in the Source Data file.

h<italic>KIF21B</italic> variants induce abnormal migration through enhanced KIF21B motor activity.

a, c, i Coronal sections of E18.5 cortices, 4 days after IUE with the indicated NeuroD-IRES-GFP constructs. GFP-positive electroporated cells are depicted in green. Nuclei are stained with DAPI. b, d, j Percentage (means ± S.E.M.) of electroporated cells in upper (Up CP) and lower (Lo CP) cortical plate, intermediate (IZ) and subventricular zone (SVZ), showing the effect of increasing (b) amount or (d) activity of hKIF21B and (j) contribution of the processive activity to the phenotype. Data were analyzed by two-way ANOVA (Bonferroni’s multiple comparisons test). Number of embryos analyzed: b Empty vector and WT 2 µg/µL, n = 3; WT 1 and 1.5 µg/µL, n = 4; dn = 3 for each condition; j Empty vector, n = 9; WT, n = 6; p.Gln313Lys, n = 8; p.Ile678Leu, n = 5; p.Ala1001Thr, n = 8; p.Gln313LysΔATP, n = 5; p.Ile678LeuΔATP, n = 8; p.Ala1001ThrΔATP, n = 6. e Immunolabeling of ST cells transfected with indicated HA-tagged hKIF21B constructs showing impaired localization of p.Ile678Leu variant. Histogram (means ± S.E.M.) represents the percentage of cells with a diffuse versus an impaired localization of the HA-tagged proteins. Data were analyzed by two-way ANOVA (Bonferroni’s multiple comparisons test). Number of cells analyzed: WT, n = 467; p.Gln313Lys, n = 429; p.Ile678Leu, n = 540; p.Ala1001Thr, n = 387; from three independent experiments. f Immunolabeling of ST cells transfected with the indicated Myc- and HA-tagged hKIF21B constructs showing that the p.Ile678Leu variant alters the localization of the WT protein. g, h Live imaging of Cos7 cells transfected with the indicated GFP-tagged hKIF21B constructs. Histograms (means ± S.E.M.) represent (g) velocities distribution and (h) mean velocities. 20–32 cells from 3–5 independent experiments were analyzed by (g) two-way ANOVA or h one-way ANOVA (Bonferroni’s multiple comparisons test). Total number of particles analyzed: WT, n = 203; p.Gln313Lys, n = 182; p.Ile678Leu, n = 195; p.Ala1001Thr, n = 237. ns non-significant; *P < 0.05; **P < 0.005; ***P < 0.001; ****P < 0.0001. Scale bars: (a, c, i) 50 μm; (e, f) 20 µm. k Model: WT KIF21B switches between an autoinhibition and an active (purple arrows) state. hKIF21B variants (marked by a star) conformation favors the active state. KIF21B hyper-motility (pink arrow) leads to migration defects. Source data are provided in the Source Data file.

Expression of p.Gln313Lys hKIF21B decreases head size in zebrafish larvae.

a Dorsal view of representative control zebrafish larvae (non-injected) or injected with 100 pg of wild-type (WT) or mutated hKIF21B mRNAs (p.Gln313Lys and p.Ala1001Thr) at 5 days post-fertilization (5 dpf). Double arrow indicates the distance between the forebrain and hindbrain, a measure used as a proxy for head size. b Dot plot of the head measurements (red double arrow) of control and injected larvae at 5 dpf. Red diamond corresponds to the mean of the batch measured. Number of embryos analyzed for this specific batch: control, n = 40; WT, n = 31; p.Gln313Lys, n = 38; p.Ala1001Thr, n = 31. Experiments were repeated six times for non-injected control embryos (n = 231), four times for WT-injected embryos (n = 127), three times for p.Gln313Lys-injected embryos (n = 108) and four times for p.Ala1001Thr-injected embryos (n = 158). ns, non-significant, *P < 0.05, **P < 0.005, ***P < 0.001. Significance was calculated by unpaired two-tailed Student’s t-test or a Welch’s two sample t-test between control and RNA-injected larvae. ns non-significant, *P < 0.05, **P < 0.005, ***P < 0.001. Source data are provided in the Source Data file.

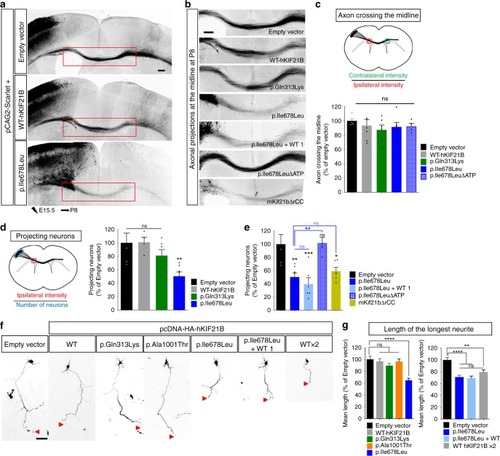
p.Ile678Leu hKIF21B variant impedes inter-hemispheric connectivity.

a Coronal sections of P8 brains after IUE with pCAG2-Scarlet and indicated NeuroD-IRES-GFP constructs. b Close-up views of the red boxed area in a showing impaired axonal inter-hemispheric connectivity upon expression of the p.Ile678Leu variant or the hyperactive mKif21bΔrCC but not upon expression of WT, p.Gln313Lys or immotile p.Ile678LeuΔATP. Rescue experiments were done by co-expressing p.Ile678Leu-hKIF21B (1 µg/µL) together with WT-hKIF21B constructs at 1 µg/µL (p.Ile678Leu + WT 1). Scale bars, 250 μm. c, d Upper (c) or left (d) panels, schematic describing methods used to quantify the percentage (c) of axon crossing the midline and (d) of projecting neurons. Lower (c) or right (d) panels, histograms presenting the percentage (c) of axon crossing the midline and (d, e) of projecting neurons. Data (means ± S.E.M.) were analyzed by one-way ANOVA (Bonferroni’s multiple comparisons test). Number of pups analyzed: c Empty vector, n = 5; WT, n = 7; p.Gln313Lys, n = 6; p.Ile678Leu, n = 6; p.Ile678LeuΔATP, n = 4; d, e empty vector, n = 5; WT, n = 4; p.Gln313Lys, n = 6; p.Ile678Leu, n = 7; p.Ile678LeuΔATP, n = 5; p.Ile678Leu + WT, n = 6; mKif21bΔrCC, n = 6. f Representative DIV2 cortical neurons transfected at DIV0 with pCAG2-Scarlet together with empty pcDNA-HA or WT (at 1 (WT) or 2 µg/µL (WT ×2)) or mutant pcDNA-HA-hKIF21B constructs. Rescue experiments were done by co-expressing mutated p.Ile678Leu hKIF21B variant together with NeuroD-WT-hKIF21B (ratio 1:1; p.Ile678Leu + WT 1). Red arrowheads point to the axon tip. g Quantification of the longest neurite length (axon) at DIV2. Bars represent the means of the longest neurite length ± S.E.M. Significance was calculated by one-way ANOVA (Bonferroni’s multiple comparisons test). Number of neurons analyzed: (left graph) Empty vector, n = 94; WT, n = 96; p.Gln313Lys, n = 104; p.Ile678Leu, n = 144; p.Ala1001Thr, n = 133, from four (Empty vector, WT, p.Ile678Leu) or three (p.Gln313Lys, p.Ala1001Thr) independent experiments; (right graph) empty vector, n = 132; WT 2 µg/µL, n = 125; p.Ile678Leu + WT, n = 146; p.Ile678Leu, n = 134; from four independent experiments. ns non-significant; *P < 0.05; **P < 0.005; ***P < 0.001; ****P < 0.0001. Scale bars, (a) 200 µm, (b) 250 µm (f) 50 µm. Source data are provided in the Source Data file.

p.Ile678Leu hKIF21B variant impairs ipsilateral axon collaterals formation.

a Representative images of ipsilateral P8 cortices after IUE, with pCAG2-Scarlet and indicated NeuroD-IRES-GFP constructs. Rescue experiments were done by co-expressing mutated p.Ile678Leu hKIF21B together with increasing amount of WT-hKIF21B (at 0.25 µg/µL (WT 0.25) or 1 µg/µL (WT 1)) or equivalent amount of hKIF21B-ΔATP or hKIF21B-T96N, that both lost their processivity. b Close-up views of red boxed area in (a) showing axon ipsilateral branching within layer V for all the indicated conditions. ce Histograms (means ± S.E.M.) showing (c, d) the quantification of the ipsilateral branching in layer V (intensity of scarlet signal in layer V (blue box) normalized on the intensity of the scarlet signal in the corpus callosum (red box) — as shown on the schematic in the upper panel) and (e) the distribution of electroporated neurons in three different regions (Up CP (upper cortical plate), Lo CP (lower cortical plate), and WM (White matter)). Data from were analyzed by (c, d) one-way ANOVA or (e) two-ways ANOVA (Bonferroni’s multiple comparisons test). Number of pups analyzed: c, d Empty vector, n = 5; WT, n = 7; p.Gln313Lys, n = 5; p.Ile678Leu, n = 14; p.Ile678Leu + WT 0.25 µg/µL, n = 7; p.Ile678Leu + WT 1 µg/µL, n = 5; p.Ile678Leu + ΔATP, n = 8; p.Ile678Leu + T96N, n = 8; p.Ile678LeuΔATP, n = 5; mKif21bΔrCC, n = 6; e Empty vector, n = 5; p.Ile678Leu, n = 6; p.Ile678Leu + WT 1 µg/µL, n = 4; p.Ile678LeuΔATP, n = 3; mKif21bΔrCC, n = 4. f Representative DIV5 cortical neurons transfected at DIV2 with pCAG2-Scarlet together with the indicated pcDNA-HA-hKIF21B constructs. g Distribution (means ± S.E.M.) of axonal collateral branches length at DIV5. Significance was calculated by two-way ANOVA (Bonferroni’s multiple comparisons test). Number of collaterals analyzed: Empty vector, n = 265; p.Ile678Leu, n = 385; from 51 (Empty vector) and 66 (p.Ile678Leu) neurons from five independent experiments. ns non-significant, *P < 0.05; **P < 0.005; ***P < 0.001; ****P < 0.0001. Scale bars, (a, b) 250 µm, (f) 150 µm. Source data are provided in the Source Data file.

Acknowledgments
This image is the copyrighted work of the attributed author or publisher, and ZFIN has permission only to display this image to its users. Additional permissions should be obtained from the applicable author or publisher of the image. Full text @ Nat. Commun.