IMAGE

Fig. 2

ID
ZDB-IMAGE-200814-12
Source
Figures for Asselin et al., 2020
Image
Figure Caption

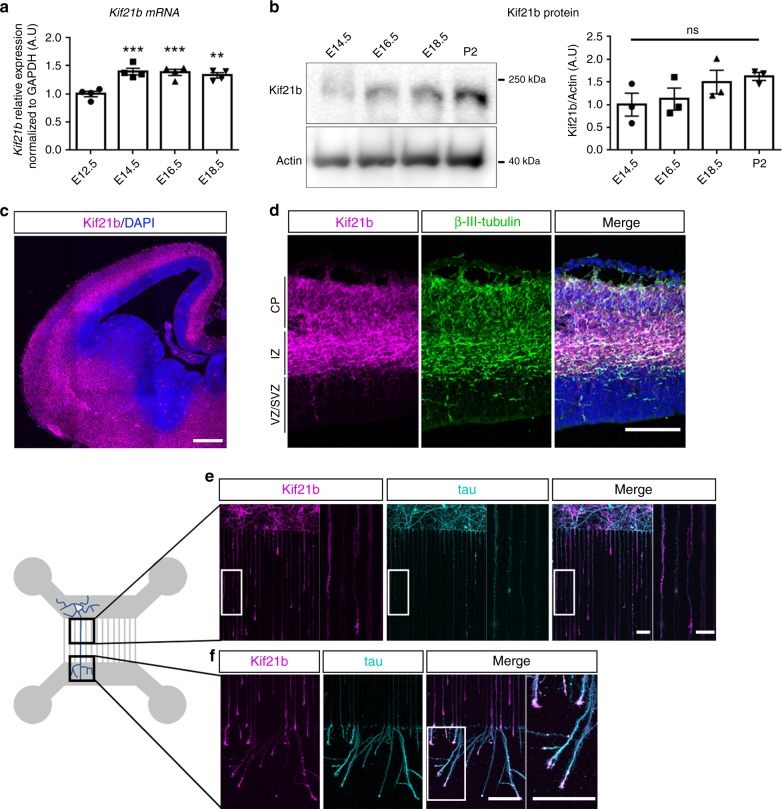
Fig. 2 Kif21b expression in mouse developing cortex.

a RT-qPCR analyses showing expression of Kif21b transcripts in mouse cortices at different embryonic stages (from E12.5 to E18.5) (n = 4 brains per stage). b Western blot analyses of mouse cortical extracts showing similar expression of Kif21b protein from E14.5 to P2 (n = 3 brains per stage). a, b Data are represented as means ± S.E.M. Significance was calculated by one-way ANOVA (Bonferroni’s multiple comparisons test), ns non-significant; **P < 0.005; ***P < 0.001. c, d E14.5 mouse forebrain coronal sections immunolabelled for Kif21b (magenta) and β-III-tubulin (neuronal marker, green) and counterstained with DAPI (blue) showing that Kif21b expression is restricted to post mitotic neurons. e, f Left panel: schematic representation of a 2-compartments microfluidic chamber. Cortical neurons (in cyan) plated in the upper chamber (gray) grow their axons through 450-μm-long microchannels. The length of the microchannels allows axons but not dendrites to reach the lower chamber. Right panel: immunolabeling of Kif21b (magenta) and tau (axonal marker, cyan) on mouse primary cortical neurons at DIV5 in microdevices showing expression of Kif21b in axons (e) with an enrichment in growth cones (f). CP cortical plate, IZ intermediate zone, SVZ subventricular zone, VZ ventricular zone. Scale bars, (c) 250 µm and (df) 100 µm, magnifications (e, f) 20 µm. Source data are provided in the Source Data file.

Acknowledgments
This image is the copyrighted work of the attributed author or publisher, and ZFIN has permission only to display this image to its users. Additional permissions should be obtained from the applicable author or publisher of the image. Full text @ Nat. Commun.