
- Title
-
Synthesis, Pharmacological and Structural Characterization of Novel Conopressins from Conus miliaris
- Authors
- Giribaldi, J., Ragnarsson, L., Pujante, T., Enjalbal, C., Wilson, D., Daly, N.L., Lewis, R.J., Dutertre, S.
- Source
- Full text @ Mar. Drugs
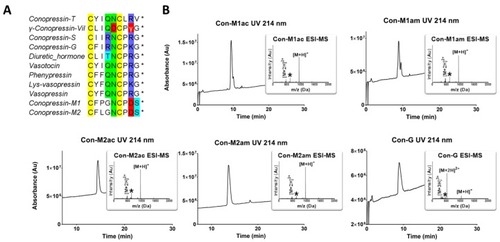
RP-HPLC/ESI-MS analyses of the synthesized conopressins and alignment of conopressin-related sequences. ( |
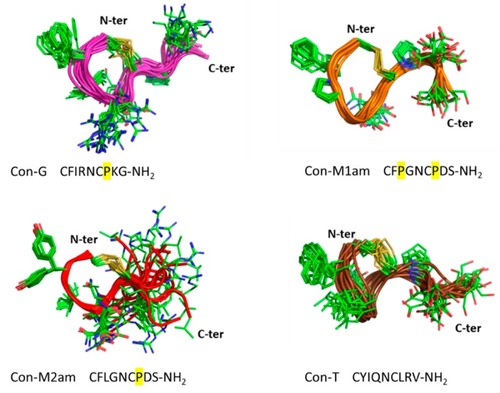
Three-dimensional structures of Con-G, Con-M1, Con-M2 and Con-T. The 20 lowest NMR structures are superimposed over the backbone atoms. The backbone is shown in ribbon format and the side-chains as sticks. Proline residues bringing constraints to the structures are highlighted in yellow. |
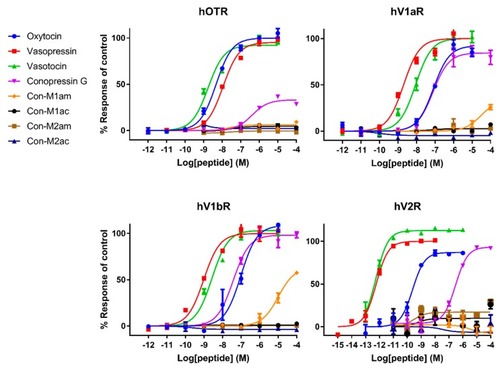
Representative concentration-response curves measuring increasing concentrations of intracellular calcium using a FLIPR assay for the hOTR, hV1aR and hV1bR, and representative concentration-response curves measuring accumulation of cAMP using a cAMP signaling assay for the hV2R of all tested compounds. Each point represents the mean of measurements from one experiment performed in triplicate. Error bars represent S.E.M. |
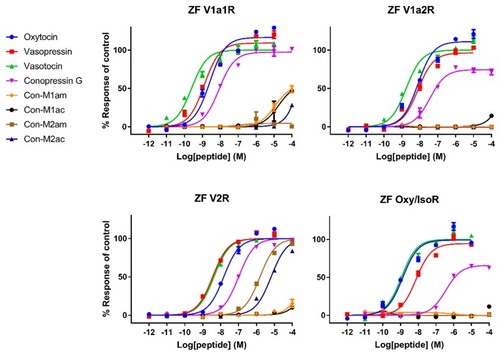
Representative concentration-response curves measuring increasing concentrations of intracellular calcium using a FLIPR assay of all tested compounds against |
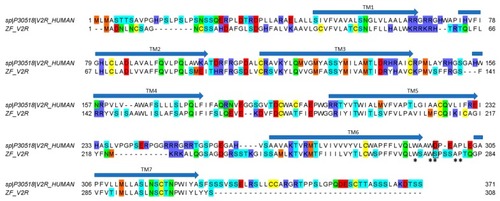
Alignment between hV2R (uniprot entry P30518) and cloned ZF V2R. The substitution of D297 in hV2R with S275 in ZF V2R is bordered in black. Asterisks (*) indicate amino-acid residues that have been suggested to participate and to be important in receptor–ligand interaction. Arrows indicate the seven putative transmembrane domains (TM 1–7). |