
Image
|
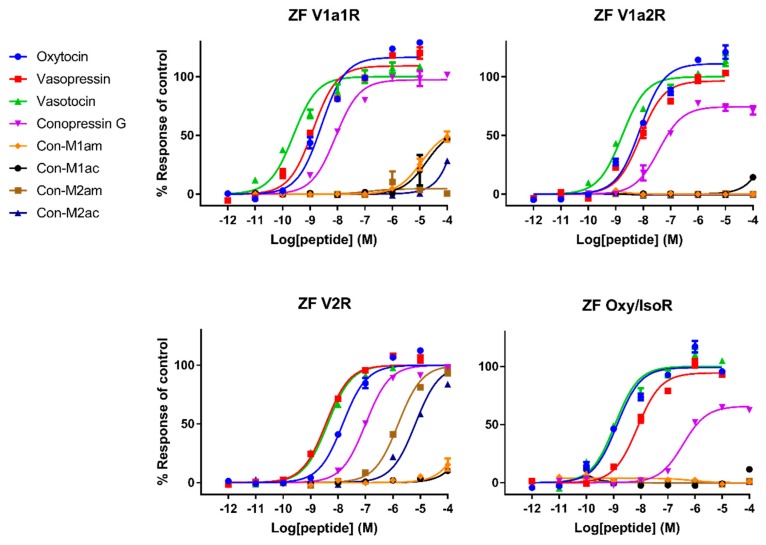
Figure Caption
Figure 4
Representative concentration-response curves measuring increasing concentrations of intracellular calcium using a FLIPR assay of all tested compounds against
Acknowledgments
This image is the copyrighted work of the attributed author or publisher, and
ZFIN has permission only to display this image to its users.
Additional permissions should be obtained from the applicable author or publisher of the image.
Full text @ Mar. Drugs