
FIGURE
Figure 3
- ID
- ZDB-FIG-200421-74
- Publication
- Giribaldi et al., 2020 - Synthesis, Pharmacological and Structural Characterization of Novel Conopressins from Conus miliaris
- Other Figures
- All Figure Page
- Back to All Figure Page
Figure 3
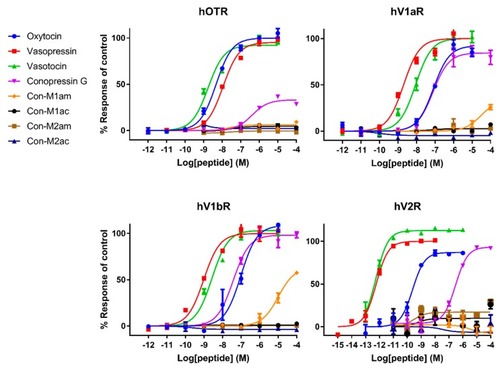
Representative concentration-response curves measuring increasing concentrations of intracellular calcium using a FLIPR assay for the hOTR, hV1aR and hV1bR, and representative concentration-response curves measuring accumulation of cAMP using a cAMP signaling assay for the hV2R of all tested compounds. Each point represents the mean of measurements from one experiment performed in triplicate. Error bars represent S.E.M. |
Expression Data
Expression Detail
Antibody Labeling
Phenotype Data
Phenotype Detail
Acknowledgments
This image is the copyrighted work of the attributed author or publisher, and
ZFIN has permission only to display this image to its users.
Additional permissions should be obtained from the applicable author or publisher of the image.
Full text @ Mar. Drugs