
- Title
-
Development of a Modified Three-Day T-maze Protocol for Evaluating Learning and Memory Capacity of Adult Zebrafish
- Authors
- Ngoc Hieu, B.T., Ngoc Anh, N.T., Audira, G., Juniardi, S., Liman, R.A.D., Villaflores, O.B., Lai, Y.H., Chen, J.R., Liang, S.T., Huang, J.C., Hsiao, C.D.
- Source
- Full text @ Int. J. Mol. Sci.
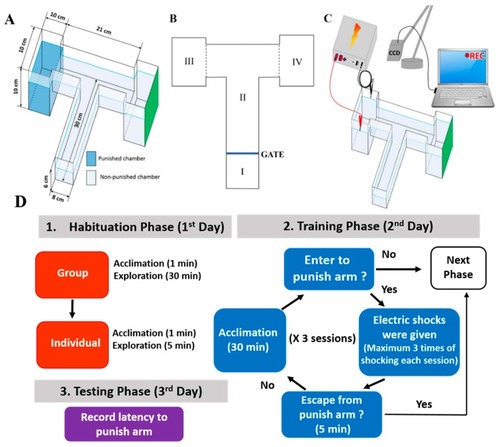
Experimental design of the T-maze apparatus in the zebrafish model. ( |
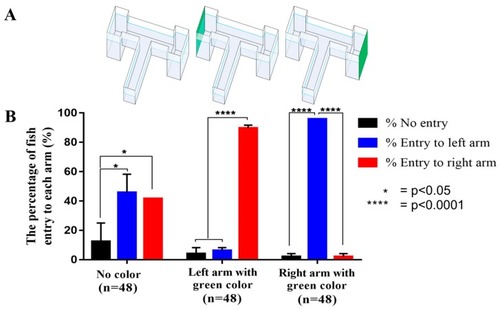
The assessment of individual fish with color cue option in the habituation phase. ( |
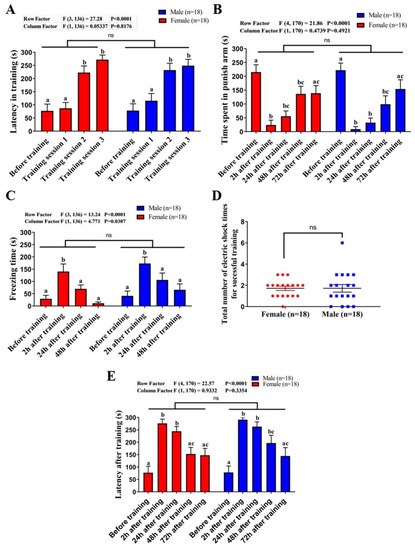
The assessment of the influence of gender on learning and memory in the T-maze test. ( |
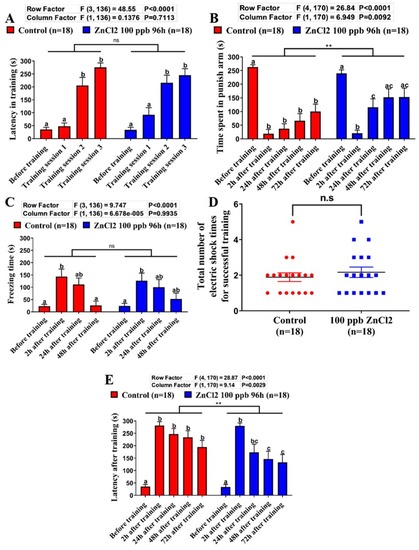
The assessment of toxicity of ZnCl2 exposure on learning and memory performances in the T-maze test. ( PHENOTYPE:
|
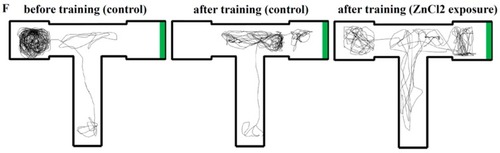
The assessment of toxicity of ZnCl2 exposure on learning and memory performances in the T-maze test. ( |
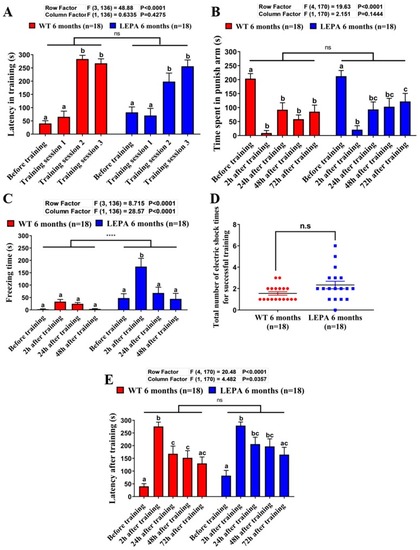
The comparison of learning and memory capabilities between WT and PHENOTYPE:
|