
IMAGE
Figure 2
- ID
- ZDB-IMAGE-200325-121
- Publication
- Ngoc Hieu et al., 2020 - Development of a Modified Three-Day T-maze Protocol for Evaluating Learning and Memory Capacity of Adult Zebrafish
- All Figures
- Figures for Ngoc Hieu et al., 2020
Image
|
Figure Caption
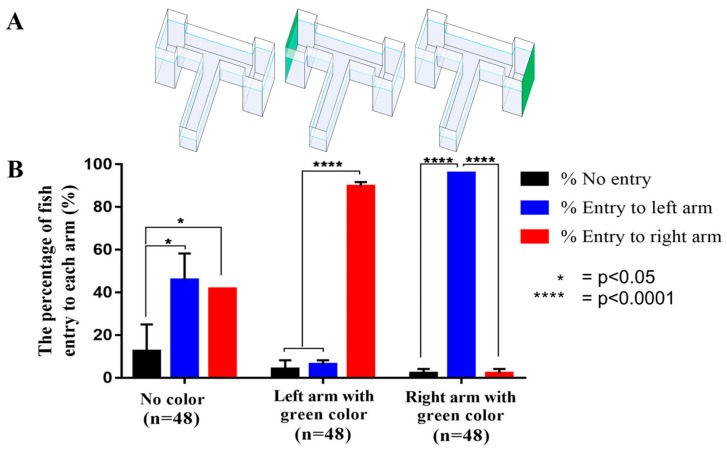
Figure 2
The assessment of individual fish with color cue option in the habituation phase. (
Acknowledgments
This image is the copyrighted work of the attributed author or publisher, and
ZFIN has permission only to display this image to its users.
Additional permissions should be obtained from the applicable author or publisher of the image.
Full text @ Int. J. Mol. Sci.