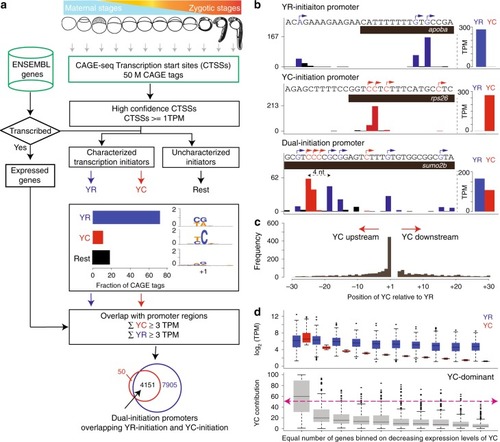
Intertwined canonical initiator (YR) and non-canonical initiator YC (alias as TCT/5’TOP) within the same core promoter.
a A systematic pipeline for identification of canonical (YR) and non-canonical (YC) initiators in the zebrafish developmental promoterome. CTSSs are classified into YR and YC initiators based on CAGE transcription start sites (CTSSs). b UCSC browser views with CAGE data from prim 5 stage to illustrate examples of YR-initiation (apoba) and YC-initiation (rps26) promoters along with a gene promoter with intertwined YR-initiations and YC-initiations (sumo2b). YR-initiations and YC-initiations are shown in blue and red colors respectively. Barplot on the right shows the sum of expression levels of YR-initiations and YC-initiations. Highest CTSS represents the dominant transcription start site. The distance between dominant YR and YC in sumo2b is four nucleotides. c Frequency of position of dominant YC-initiation relative to dominant YR-initiation in dual-initiation promoters. d Contribution of YC-initiation with respect to YR-initiation expression levels in prim 5 stage. The 4151 genes with dual-initiation are sorted according to YC expression levels and grouped into 10% bins. Expression levels (top) and proportion of YC-initiation to total (bottom) are shown. Red dash line indicates 50% cutoff. TPM, tags per million.
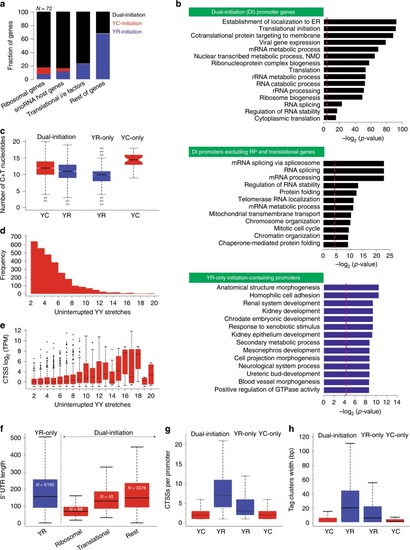
Characteristic features of dual-initiation and single initiation promoter genes.
a Stack bar of proportion of single/dual-initiation promoter genes among translation-associated gene families as indicated. b Gene ontology (GO) categories of single and dual-initiation promoter genes clustered as indicated in green fields. c Sequence composition around dominant YR-initiation and YC-initiation sites of single/dual-initiation promoters. d, e Presence of polypyrimidine stretches in DI promoters. X-axis indicates the length of uninterrupted pyrimidine stretch with respect to YC-initiation frequency (d) and expression levels of YC-initiation sorted by increasing frequency of uninterrupted polypyrimidine stretches (e). f 5′ UTR length of dual-initiation and single initiation YR genes. g Frequency of CTSS in single/dual-initiation promoter genes. h Tag cluster width of single/dual-initiation promoter genes. Boxplots show the 5th, 25th, 50th, 75th, and 95th percentiles where center line is the median.
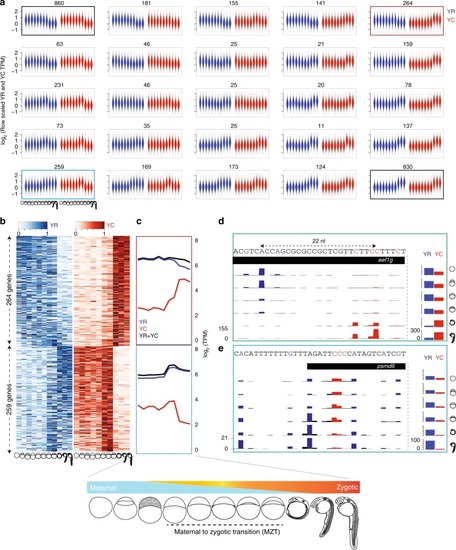
Maternal to zygotic transition of YR-initiation and YC-initiation.
a Violin plot of expression profiles (tags per million) of YR and YC components of genes during embryo development clustered by Self Organizing Map (SOM) analysis. Blue and red colors indicate YR and YC components respectively. X-axis represents developmental stages as indicated. Y-axis indicates expression levels scaled between YC and YR components separately. Numbers indicate genes in the cluster. b Heatmap rows show the gene expression profiles with YR and YC-initiation of selected SOM clusters indicated by the gene numbers on the left. Expression values are scaled row-wise between 0 to 1, separately for YR and YC. Genes are ranked by statistical significance of anticorrelation. Black line indicates significance threshold (−0.5). c Averaged expression level of total (black) YR-initiation (blue) and YC-initiation (red) across the clustered group of genes shown in b. d, e UCSC genome browser views of CTSSs for the eef1g and psmd6 gene promoters. Barplots on the right shows the sum of CTSSs of YR-initiation and YC-initiation events respectively. Distance between dominant YC and YR-initiation is indicated in d.
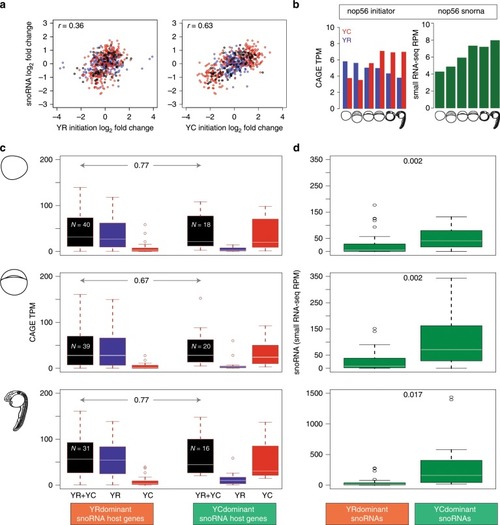
Correlation of expression levels of YR and YC components of snoRNA host genes with that of snoRNA expression levels.
a Scatter plot of correlations between snoRNA log fold changes with YR-initiation log fold changes (left), and with YC-initiation log fold changes (right) across six developmental stages among 94 dual-initiation snoRNA host genes. Each point corresponds to one stage-gene pair of YR-dominant transcripts (blue), YC-dominant transcripts (red) and the rest (black). b Bar plot of CAGE expression levels (tpm) of YR (blue) and YC (red) components of initiation at the nop56 gene. Expression levels of snoRNA (dark green) were calculated from small RNA-seq data in reads per million. c Box plot of TPM expression levels of YR-initiation (blue), YC-initiation (red), and total (black) of YR-dominant and YC-dominant snoRNA host genes selected for comparable total expression level are shown. The number of YR-dominant and YC-dominant snoRNA host genes are denoted by “N”. d Box plot of expression levels of corresponding snoRNAs (green) from YR-dominant and YC-dominant host genes shown in d. Developmental stages are fertilized egg, 30% epiboly and prim 5 stages (top to bottom) are depicted on the left. Boxplots show the 5th, 25th, 50th, 75th, and 95th percentiles where center line is the median.
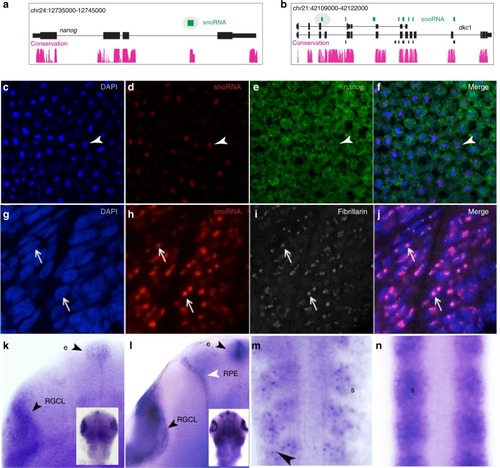
Localization of snoRNAs and host mRNA products in the embryo.
a, b A UCSC browser showing annotated snoRNAs (green) in the introns of nanog and dyskerin (dkc1). Ensembl annotated genes and snoRNAs are shown as black tracks. Teleost sequence conservation tracks are shown in magenta. Two snoRNAs selected for expression analysis are highlighted in oval. c–e In situ hybridization in whole mount zebrafish embryos at the 30% epiboly stage with probes detecting nuclei (c), snoRNA gene embedded in nanog (d) nanog coding exon (e), and overlay (f). ARrowheads indicate overlapping spots. g–j In situ hybridization with snoRNA probe (h) for the dyskerin gene is detected in the nucleoli of somitic nuclei detected by DAPI (g), and indicated by immunohistochemical detection of fibrallin (i and overlay in j). Arrows indicate the same spots in the overlapping frames. k–n In situ hybridization probes detect dyskerin and embedded snoRNA gene activities in long-pec stage embryos. k, m snoRNA probe detects expression in epiphysis (arrowhead with e), retinal ganglion cell layer (arrowhead with RGLC) and the somites (arrowhead in m). l, n Exon probe for dyskerin indicates cytoplasmic expression in the epiphysis (arrowhead and e), retinal ganglion cell layer (arrowhead RGCL), and retinal-pigmented epithelium (white arrowhead and RPE) and the somites (s, black arrowhead in n). Inserts in k and l show dorsal views of heads, from which the magnified views are cropped.
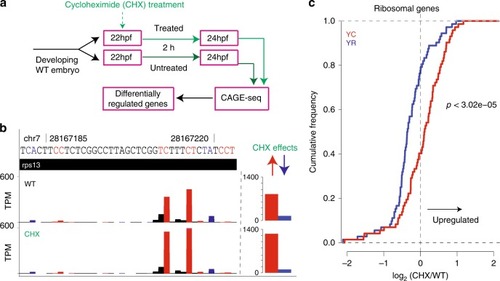
Differential regulation of YR-initiation and YC-initiation during translation inhibition.
a Experimental design to study the response of YC-initiation and YR-initiation products during translation inhibition by cycloheximide. b A UCSC browser screenshot showing an example of levels of YR and YC components of the dual-initiation promoter gene rps13. The bar chart includes sum of all peaks. c Cumulative frequency of YR-initiation and YC-initiation of all ribosomal protein genes after cycloheximide treatment. X-axis indicates the log2 fold change of YR-initiation and YC-initiation in cycloheximide and wild type condition.
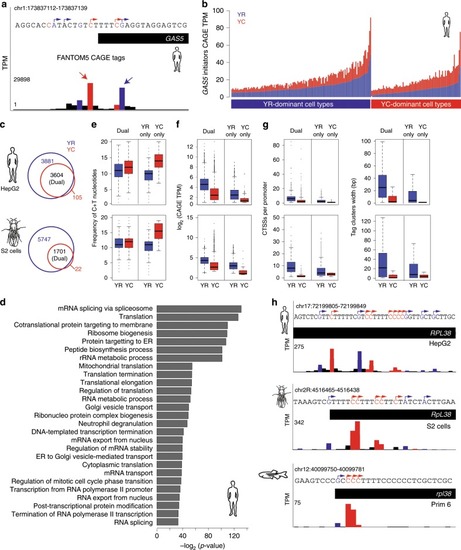
Dual-initiation (DI) promoters are conserved in human and <italic>Drosophila</italic>.
a A UCSC browser screenshot of human GAS5 promoter CAGE data (summed CTSSs) in FANTOM5 cell types. CTSSs show transcription of YR-initiation and YC-initiation within same core promoter region. b Expression levels of YR-initiations and YC-initiations by summing their CTSSs. Promoter are classified as YR-dominant or YC-dominant across individual cell types and their expression is shown in stacked bars. Y-axis shows the expression levels measured in tags per million (TPM). c Venn diagram with intersection of gene promoters with YR and YC-initiation in human HepG2 and Drosophila S2 cells. DI promoters are indicated in the overlap between detected YR-initiation and YC-initiation. d Enrichment of gene ontology terms of DI promoters in human HepG2 cell line. e Comparison of C+T sequence content around transcription start sites in DI promoters with YR-only or YC-only initiation promoter in human and drosophila. f Expression levels of DI promoter genes in human and Drosophila. g Frequency of CTSSs and promoter width of DI promoters in human and Drosophila. h UCSC browser screenshots showing CTSSs in the promoter region of RPL38 gene in human, Drosophila and zebrafish. YR-initiation and YC-initiation peaks are colored as blue and red. Boxplots show the 5th, 25th, 50th, 75th, and 95th percentiles where center line is the median.
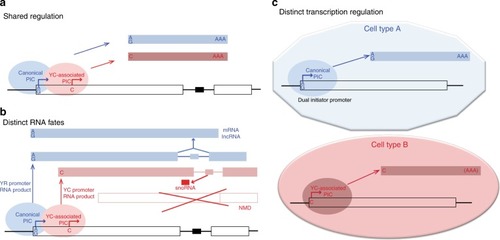
Models for utilization of dual-initiation promoters during development.
a Dual-initiation promoters can be occupied by pre-initiation complexes (PIC) in a cell to generate two RNA products with distinct 5′ end base. These products can be produced on a shared promoter coordinately by partially overlapping PICs or by distinct PICs recruited coordinately. The co-regulation may occur on the cell or tissue level. b Model for differential utilization of YC and YR-initiation by divergent PICs to generate RNAs with distinct fate in the same or distinct cells. E.g. PICs form on the YR-initiation site for generating a protein coding mRNA or non-coding RNA gene product from a snoRNA host gene, while the YC-initiation may be utilized by a specialized PIC to produce an RNA which is processed to splice out snoRNAs and subjected to distinct degradation pathways. c A dual-initiation promoter is utilized divergently by YR and YC associated initiation complexes to adapt to requirements in different cells such as maternal activity in the oocyte versus zygotic activity in an embryonic cell.
Acknowledgments
This image is the copyrighted work of the attributed author or publisher, and
ZFIN has permission only to display this image to its users.
Additional permissions should be obtained from the applicable author or publisher of the image.
Full text @ Nat. Commun.
Your Input Welcome
Thank you for submitting comments. Your input has been emailed to ZFIN curators who may contact you if
additional information is required.
Oops. Something went wrong. Please try again later.