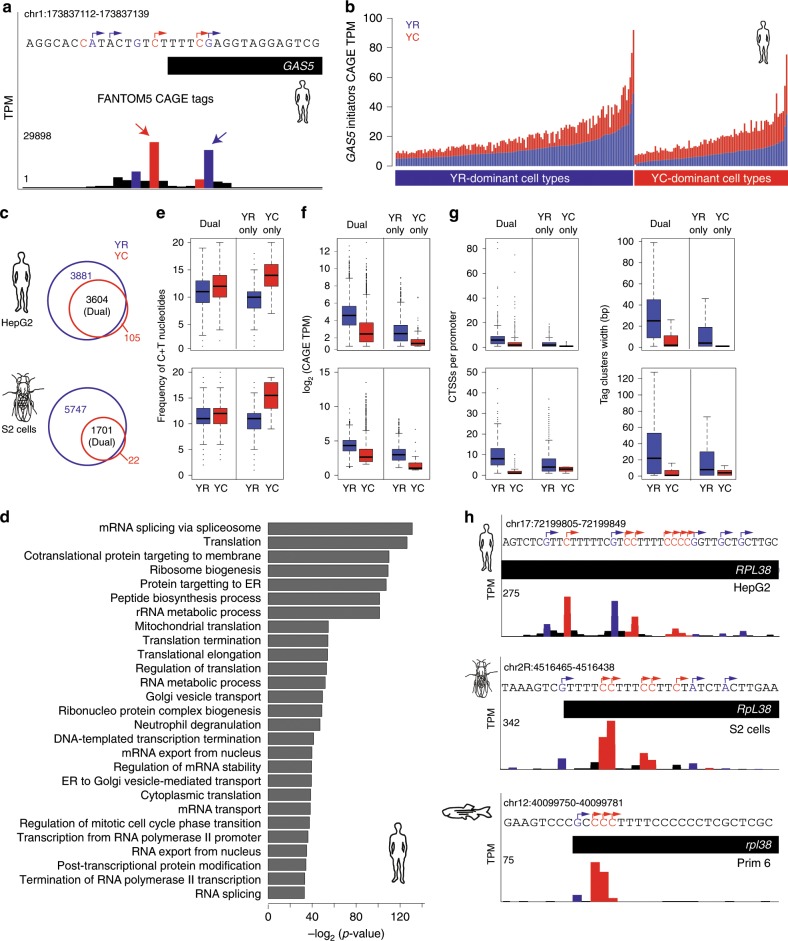
IMAGE

Fig. 7

ID
ZDB-IMAGE-200115-16
Source
Figures for Nepal et al., 2020
Image
Figure Caption

Fig. 7 Dual-initiation (DI) promoters are conserved in human and <italic>Drosophila</italic>.

a A UCSC browser screenshot of human GAS5 promoter CAGE data (summed CTSSs) in FANTOM5 cell types. CTSSs show transcription of YR-initiation and YC-initiation within same core promoter region. b Expression levels of YR-initiations and YC-initiations by summing their CTSSs. Promoter are classified as YR-dominant or YC-dominant across individual cell types and their expression is shown in stacked bars. Y-axis shows the expression levels measured in tags per million (TPM). c Venn diagram with intersection of gene promoters with YR and YC-initiation in human HepG2 and Drosophila S2 cells. DI promoters are indicated in the overlap between detected YR-initiation and YC-initiation. d Enrichment of gene ontology terms of DI promoters in human HepG2 cell line. e Comparison of C+T sequence content around transcription start sites in DI promoters with YR-only or YC-only initiation promoter in human and drosophila. f Expression levels of DI promoter genes in human and Drosophila. g Frequency of CTSSs and promoter width of DI promoters in human and Drosophila. h UCSC browser screenshots showing CTSSs in the promoter region of RPL38 gene in human, Drosophila and zebrafish. YR-initiation and YC-initiation peaks are colored as blue and red. Boxplots show the 5th, 25th, 50th, 75th, and 95th percentiles where center line is the median.

Acknowledgments
This image is the copyrighted work of the attributed author or publisher, and ZFIN has permission only to display this image to its users. Additional permissions should be obtained from the applicable author or publisher of the image. Full text @ Nat. Commun.