|
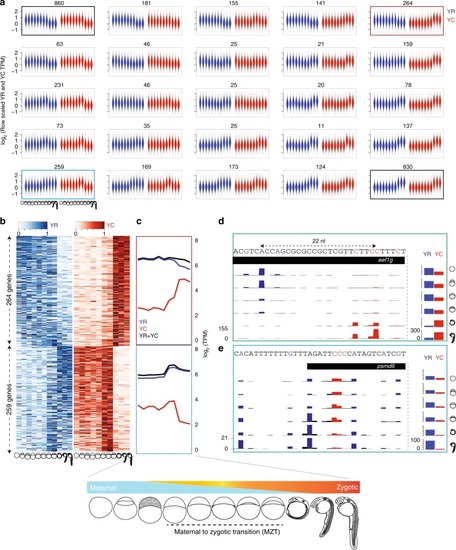
Maternal to zygotic transition of YR-initiation and YC-initiation.a Violin plot of expression profiles (tags per million) of YR and YC components of genes during embryo development clustered by Self Organizing Map (SOM) analysis. Blue and red colors indicate YR and YC components respectively. X-axis represents developmental stages as indicated. Y-axis indicates expression levels scaled between YC and YR components separately. Numbers indicate genes in the cluster. b Heatmap rows show the gene expression profiles with YR and YC-initiation of selected SOM clusters indicated by the gene numbers on the left. Expression values are scaled row-wise between 0 to 1, separately for YR and YC. Genes are ranked by statistical significance of anticorrelation. Black line indicates significance threshold (−0.5). c Averaged expression level of total (black) YR-initiation (blue) and YC-initiation (red) across the clustered group of genes shown in b. d, e UCSC genome browser views of CTSSs for the eef1g and psmd6 gene promoters. Barplots on the right shows the sum of CTSSs of YR-initiation and YC-initiation events respectively. Distance between dominant YC and YR-initiation is indicated in d.
|