FIGURE SUMMARY
Title

Shigella sonnei infection of zebrafish reveals that O-antigen mediates neutrophil tolerance and dysentery incidence

Authors
Torraca, V., Kaforou, M., Watson, J., Duggan, G.M., Guerrero-Gutierrez, H., Krokowski, S., Hollinshead, M., Clarke, T.B., Mostowy, R.J., Tomlinson, G.S., Sancho-Shimizu, V., Clements, A., Mostowy, S.
Source
Full text @ PLoS Pathog.

<italic>S</italic>. <italic>sonnei</italic> is more virulent than <italic>S</italic>. <italic>flexneri</italic> in a zebrafish infection model.

A,B. S. sonnei is more virulent than S. flexneri in vivo. Survival curves (A) and Log10-transformed CFU counts (B) of larvae injected in the hindbrain ventricle (HBV) with PBS (grey), S. flexneri (blue) or S. sonnei (red). Experiments are cumulative of 3 biological replicates. In B, full symbols represent live larvae and empty symbols represent larvae that at the plating timepoint had died within the last 16 hours. Statistics: Log-rank (Mantel-Cox) test (A); unpaired t-test on Log10-transformed values (B); **p<0.0021; ***p<0.0002; ****p< 0.0001. C,D. S. sonnei elicits a stronger inflammatory signature than S. flexneri in vivo. Quantitative real time PCR for representative inflammatory markers were performed on pools of 20 HBV injected larvae collected at 6 (C) or 24 (D) hpi with PBS (grey), S. flexneri (blue) or S. sonnei (red). Experiments are cumulative of 4 biological replicates. Statistics: one-way ANOVA with Sidak’s correction on Log2-transformed values; ns, non-significant; *p<0.0332 **p<0.0021; ***p<0.0002; ****p<0.0001. E,F. S. sonnei can disseminate from the injection site. Representative images of three GFP-labelled S. flexneri-infected (E) or S. sonnei-infected (F) larvae at 24 hpi. In D, arrows indicate dissemination in the blood circulation; arrowheads indicate dissemination in the neuronal tube. Scale bars = 1 mm.

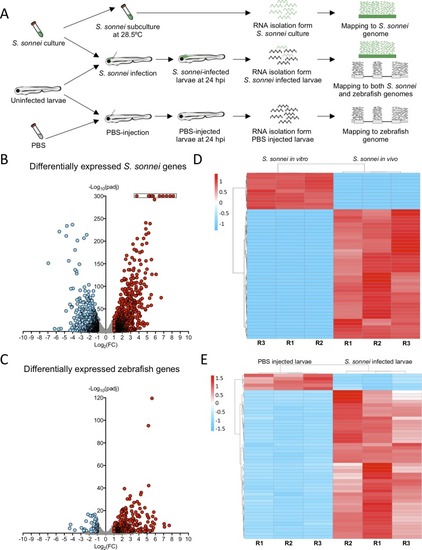
Whole animal dual-RNAseq profiling of <italic>S</italic>. <italic>sonnei</italic> infected larvae.

A. Workflow for dual-RNAseq processing. 3 dpf larvae were infected with ~7000 CFU of S. sonnei. Pools of infected larvae were collected for RNA isolation at 24 hpi. As a control for the bacterial transcriptome, the same cultures of S. sonnei were diluted 50x and subcultured at 28.5°C (same temperature at which infected larvae are maintained) until Log phase (OD600 ~0.6) was reached. As a control for the zebrafish transcriptome, pools of PBS-injected larvae at 24 hpi were used. Reads from infected larvae were mapped separately to both the S. sonnei and zebrafish genomes, while reads from S. sonnei in vitro cultures and PBS injected larvae were mapped to the pathogen or host genome, respectively. B,C. Volcano plots for bacterial and zebrafish genes during S. sonnei infection. Each datapoint refers to a single gene. Non significantly differentially expressed genes are shown in grey, while significantly downregulated genes are shown in blue and significantly upregulated genes are shown in red. Plot in B refers to S. sonnei genes and plot in C refers to zebrafish genes. See also S2 Fig for additional details. Log2(FC) and -Log10(padj) coordinates were derived from data analysis with the DESeq2 package in R. In B, points enclosed in the black rectangle were computed to have a DESeq2 padj = 0. D,E. Heatmap of the top 50 differentially expressed bacterial and zebrafish genes during S. sonnei infection. Columns represent individual biological replicates (R1, R2, R3). Heatmaps were created from counts per million (CPM) reads values, using “pheatmap” package in R. Shades of blue indicate downregulation and shades of red indicate upregulation compared to baseline. Plot in D refers to S. sonnei genes and plot in E refers to zebrafish genes. From top to bottom, genes represented in D are: adhE_3, glyA, purF, purD, purL, SSON53G_RS25460 (treB-like), gcvP, gcvH, yjiY, gcvT, treC, SSON53G_RS05440 (ymdF-like), gadC, SSON53G_RS20945 (slp-like), otsA, SSON53G_RS02230 (bolA-like), suhB, katE, SSON53G_RS31575 (mcbA-like), hdeD, gadB_1, gadB_2, yohC, gadE, hdeB, SSON53G_RS09595 (narU-like), yegP, ycgB, hdeA, SSON53G_RS20815 (yhiM-like), fadB, yafH, fadA, dadA, artJ, argC, ygjG, argI, yjbJ, aceA, narZ, trxC, aceB_1, argA, modA, ybaT, ybaA, modB, phoH, rmf. From top to bottom, genes represented in E are: krtt1c19e, si:dkey-183i3.5 (thread biopolymer filament subunit alpha-like), zgc:136930 (thread biopolymer filament subunit gamma-like), cyt1, cyt1l, irg1l, si:ch211-153b23.4 (YrdC domain-containing protein-like), si:ch211-153b23.5, timp2b, mmp13a, junbb, tnfaip2b, noxo1a, zgc:111983 (mucin-like), c4b, c3a.1, mpeg1.2, si:ch211-39f2.3 (tecta-like), socs3b, tmem176l.4, zgc:174917 (phytanoyl-CoA dioxygenase domain-containing protein 1-like), lgals1l1, cebpb, mmp9, si:ch211-15b10.6 (tifa-like), fosl2, moxd1, cbln11, lect2l, cfb, steap4, irf1b, il1b, si:ch211-183d5.2 (nedd8-like), atf3, cxcl8a, si:dkey-33c14.3 (uncharacterised lincRNA), cxcl18b, cr926130.2 (uncharacterised lincRNA), socs3a, nfkbiaa, tnfrsf9a, zgc:153932 (gp2-like), sult5a1, si:dkey-239b22.1 (tecta-like), si:dkey-247k7.2, cr855311.1 (uncharacterised non-coding RNA), cp, cbx7a, c3a.6. Gene names in brackets are inferred by manual annotations based on protein alignments performed on the UniProt database (https://www.uniprot.org/). For genes not predicted to encode a protein, manual annotations were inferred from the Ensembl database (https://www.ensembl.org/). See also S1 and S2 Tables for the extended gene lists and S2 Fig for in-depth exploration of the data.

<italic>S</italic>. <italic>sonnei</italic> virulence depends on its O-antigen.

A,B. Virulence of S. sonnei depends on its virulence plasmid. Survival curves (A) and Log10-transformed CFU counts (B) of larvae injected in the HBV with S. sonnei -pSS (grey), Δmxid (blue) or WT (red) strains. Experiments are cumulative of 3 biological replicates. In B, full symbols represent live larvae and empty symbols represent larvae that at the plating timepoint had died within the last 16 hours. Statistics: Log-rank (Mantel-Cox) test (A); one-way ANOVA with Sidak’s correction on Log10-transformed data (B); ns, non-significant; **p<0.0021; ****p<0.0001. See also S3H–S3K Fig for experiments at 32.5°C. C,D. Virulence of S. sonnei depends on its O-antigen. Survival curves (C) and Log10-transformed CFU counts (D) of larvae injected in the HBV with S. sonnei ΔO-Ag (blue) or WT (red) strains. Experiments are cumulative of 3 biological replicates. In D, full symbols represent live larvae and empty symbols represent larvae that at the plating timepoint had died within the last 16 hours. Statistics: Log-rank (Mantel-Cox) test (C); unpaired t-test on Log10-transformed data (D); ****p<0.0001. See also S3H–S3K Fig for experiments at 32.5°C.

<italic>S</italic>. <italic>sonnei</italic> O-antigen can counteract clearance by zebrafish neutrophils.

A,B. Macrophages and neutrophils are recruited to S. sonnei in vivo. Larvae of the Tg(mpeg1:Gal4-FF)gl25/Tg(UAS-E1b:nfsB.mCherry)c264 strain (labelling macrophages, A) or of the Tg(lyz:dsRed)nz50 strain (labelling neutrophils, B) were injected with PBS (blue) or S. sonnei (red) in the HBV. Recruitment was quantified from images at 6 hpi. Experiments are cumulative of 3 biological replicates. Statistics: two-tailed Mann-Whitney test; ****p<0.0001. C,D. Macrophage ablation does not increase susceptibility to S. sonnei. Survival curves (C) and Log10-transformed CFU counts (D) of Tg(mpeg1:Gal4-FF)gl25/Tg(UAS-E1b:nfsB.mCherry)c264 larvae which were treated with either Metronidazole (Mtz, macrophage ablated group, blue) or control DMSO vehicle (DMSO, red) prior to infection in the HBV with S. sonnei. Experiments are cumulative of 3 biological replicates. In D, full symbols represent live larvae and empty symbols represent larvae that at the plating timepoint had died within the last 16 hours. Statistics: Log-rank (Mantel-Cox) test (C); unpaired t-test on Log10-transformed data (D); ns, non-significant. E,F. pu.1 morpholino knockdown increases susceptibility to S. sonnei. Survival curves (E) and Log10-transformed CFU counts (F) of pu.1 morphant (blue) or control (red) larvae infected in the HBV with S. sonnei. Experiments are cumulative of 3 biological replicates. In F, full symbols represent live larvae and empty symbols represent larvae that at the plating timepoint had died within the last 16 hours. Statistics: Log-rank (Mantel-Cox) test (E); unpaired t-test on Log10-transformed data (F); ns, non-significant; ****p<0.0001. G,H. Virulence of ΔO-Ag S. sonnei can be observed in pu.1 morphants. Survival curves (G) and Log10-transformed CFU counts (H) of pu.1 morphant (blue) or control (red) larvae infected in the HBV with ΔO-Ag S. sonnei. To allow full ablation of immune cells by morpholino knockdown, infections were performed at 30 hours post-fertilisation (hpf). Experiments are cumulative of 3 biological replicates. In H, full symbols represent live larvae and empty symbols represent larvae that at the plating timepoint had died within the last 16 hours. Statistics: Log-rank (Mantel-Cox) test; ****p<0.0001.

<italic>S</italic>. <italic>sonnei</italic> can resist phagolysosome acidification and promote neutrophil cell death in an O-antigen-dependent manner.

A. S. sonnei is collected by neutrophils in large phagosomes. Larvae of the Tg(lyz:dsRed)nz50 strain (labelling neutrophils) were injected in the HBV with WT GFP-S. sonnei. Image taken at 3 hpi. Scale bar = 20 μm. B. S. sonnei is acidified in immune cell phagosomes. Larvae were injected in the HBV with WT GFP-S. sonnei which was also stained with pHrodo, a pH-sensitive dye that turns red in acidic environments. Image taken at 4 hpi, where GFP signal is attenuated for bacteria residing in acidified phagosomes (i.e. GFP is unstable and quenched at pH<6). Dashed lines highlight the outline of individual phagocytes. Scale bar = 10 μm. C,D. S. sonnei O-antigen contributes to acid tolerance in vitro. Growth curves of ΔO-Ag (blue) or WT (red) S. sonnei, cultured in tryptic soy broth adjusted to pH = 5 (C) or 7 (D). Statistics: unpaired t-test at the latest timepoint; ns, non-significant; **p<0.0021. E,F. S. sonnei requires the O-antigen to survive in phagosomes. Transmission electron micrographs of infected phagocytes from zebrafish larvae at 3 hpi with WT (E) or with ΔO-Ag (F) S. sonnei. E shows an intact phagocyte and S. sonnei residing within a phagosome (arrow points at phagosomal membrane). F shows that ΔO-Ag S. sonnei bacteria being degraded by a phagocyte (arrows point at region of major loss of bacterial cell integrity). Scale bars = 3 μm (E); 2 μm (F). G-J. The O-antigen is required for S. sonnei-mediated killing of neutrophils. Representative micrographs of larvae of the Tg(lyz:dsRed)nz50 strain injected in the HBV with PBS (G), GFP-ΔO-Ag (H) or WT (I) S. sonnei at 6 hpi and quantification of total neutrophil number at 6 and 24 hpi (J). Statistics: Kruskal-Wallis test with Dunn’s correction; ns, non-significant; ****p<0.0001. Scale bars = 250 μm.

Phagolysosome acidification controls <italic>S</italic>. <italic>sonnei</italic> clearance by zebrafish and human neutrophils.

A,B. Bafilomycin treatment increases susceptibility to WT and ΔO-Ag S. sonnei. Survival curves of larvae treated with control DMSO vehicle (blue) or Bafilomycin (red) upon infection in the HBV with WT (A) or ΔO-Ag (B) S. sonnei. Experiments are cumulative of 3 biological replicates. Bacterial input: ~7000 CFU. Statistics: Log-rank (Mantel-Cox) test; ****p<0.0001. C. ATP injections protect against S. sonnei infection. Survival curves of larvae injected in the HBV with control water (blue) or ATP (red) 3 hours prior to infection of the same compartment with S. sonnei. Experiments are cumulative of 3 biological replicates. Bacterial input: ~7000 CFU. Statistics: Log-rank (Mantel-Cox) test; ****p<0.0001. D. Bafilomycin treatment and ATP injections counteract each other. Survival curves of larvae injected in the HBV with ATP 3 hours prior to infection of the same compartment with S. sonnei and treatment with control DMSO vehicle (blue) or Bafilomycin (red). Experiments are cumulative of 3 biological replicates. Bacterial input: ~7000 CFU. Statistics: Log-rank (Mantel-Cox) test; ****p<0.0001. E,F. S. sonnei O-Ag is required to counteract acidification-mediated clearance by human neutrophils.ΔO-Ag (grey), complemented strain (ΔO-Ag+pSSO-Ag, blue) or WT (red) S. sonnei were incubated with peripheral human neutrophils and exposed to DMSO (vehicle control treatment, E) or Bafilomycin (F). Difference in bacterial killing was quantified by plating from lysates of infected neutrophils at 1 hpi. Experiments are cumulative of 3 biological replicates from 3 independent donors. Statistics: one-way ANOVA with Sidak’s correction; ns, non-significant; *p<0.0332; **p<0.0021. G,H. Model of S. sonnei O-antigen counteracting neutrophils in vivo. Upon phagocytosis of WT S. sonnei (green), zebrafish neutrophils (red) rapidly acidify phagolysosomes containing bacteria. However, S. sonnei can tolerate this environment because of its O-antigen. S. sonnei replication leads to neutrophil and host death (G). S. sonnei without O-antigen fails to counteract acidification of neutrophil phagolysosomes. In this case, neutrophils clear infection and the host survives (H).

Innate immunity can be trained to control <italic>S</italic>. <italic>sonnei in vivo</italic>.

A. Model for S. sonnei reinfection. 2 dpf embryos were primed with PBS or a sublethal dose of S. sonnei. At 48 hours post primary infection (hp1i), larvae where challenged with a lethal dose of S. sonnei and monitored by survival assay for 72 hours post-secondary infection (hp2i). B,C. Innate immune training to S. sonnei is dependent on O-antigen. Survival curves (B) and Log10-transformed CFU counts (C) of 4 dpf larvae infected in the HBV with lethal dose (~8000 CFU) of mCherry-WT S. sonnei. 48 hours prior to infection with lethal dose, embryos were primed by delivering PBS (grey), or a sublethal dose (~80 CFU) of GFP-ΔO-Ag (blue) or GFP-WT (red) S. sonnei. Experiments are cumulative of 4 (B) or 3 (C) biological replicates. In C, full symbols represent live larvae and empty symbols represent larvae that at the plating timepoint had died within the last 16 hours. Statistics: Log-rank (Mantel-Cox) test (B); one-way ANOVA with Sidak’s correction on Log10-transformed data (C); ns, non-significant; *p<0.0332; ***p<0.0002; ****p<0.0001.

Acknowledgments
This image is the copyrighted work of the attributed author or publisher, and ZFIN has permission only to display this image to its users. Additional permissions should be obtained from the applicable author or publisher of the image. Full text @ PLoS Pathog.