Figure Caption
Fig 2
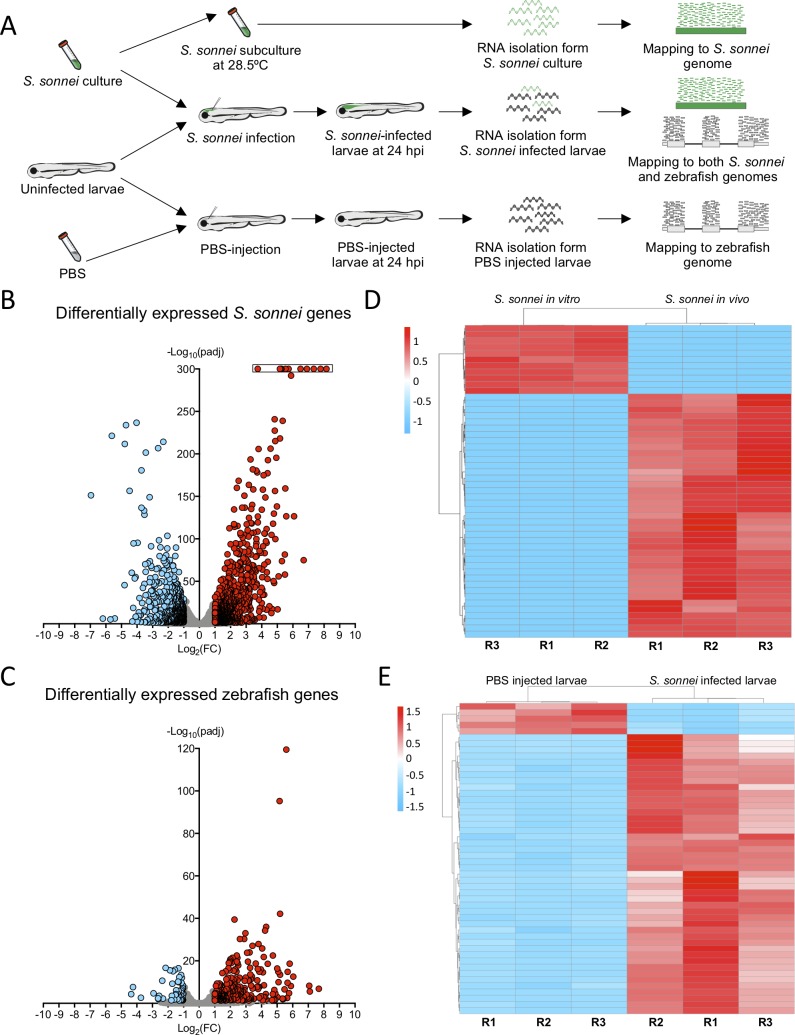
Whole animal dual-RNAseq profiling of <italic>S</italic>. <italic>sonnei</italic> infected larvae.A. Workflow for dual-RNAseq processing. 3 dpf larvae were infected with ~7000 CFU of S. sonnei. Pools of infected larvae were collected for RNA isolation at 24 hpi. As a control for the bacterial transcriptome, the same cultures of S. sonnei were diluted 50x and subcultured at 28.5°C (same temperature at which infected larvae are maintained) until Log phase (OD600 ~0.6) was reached. As a control for the zebrafish transcriptome, pools of PBS-injected larvae at 24 hpi were used. Reads from infected larvae were mapped separately to both the S. sonnei and zebrafish genomes, while reads from S. sonnei in vitro cultures and PBS injected larvae were mapped to the pathogen or host genome, respectively. B,C. Volcano plots for bacterial and zebrafish genes during S. sonnei infection. Each datapoint refers to a single gene. Non significantly differentially expressed genes are shown in grey, while significantly downregulated genes are shown in blue and significantly upregulated genes are shown in red. Plot in B refers to S. sonnei genes and plot in C refers to zebrafish genes. See also S2 Fig for additional details. Log2(FC) and -Log10(padj) coordinates were derived from data analysis with the DESeq2 package in R. In B, points enclosed in the black rectangle were computed to have a DESeq2 padj = 0. D,E. Heatmap of the top 50 differentially expressed bacterial and zebrafish genes during S. sonnei infection. Columns represent individual biological replicates (R1, R2, R3). Heatmaps were created from counts per million (CPM) reads values, using “pheatmap” package in R. Shades of blue indicate downregulation and shades of red indicate upregulation compared to baseline. Plot in D refers to S. sonnei genes and plot in E refers to zebrafish genes. From top to bottom, genes represented in D are: adhE_3, glyA, purF, purD, purL, SSON53G_RS25460 (treB-like), gcvP, gcvH, yjiY, gcvT, treC, SSON53G_RS05440 (ymdF-like), gadC, SSON53G_RS20945 (slp-like), otsA, SSON53G_RS02230 (bolA-like), suhB, katE, SSON53G_RS31575 (mcbA-like), hdeD, gadB_1, gadB_2, yohC, gadE, hdeB, SSON53G_RS09595 (narU-like), yegP, ycgB, hdeA, SSON53G_RS20815 (yhiM-like), fadB, yafH, fadA, dadA, artJ, argC, ygjG, argI, yjbJ, aceA, narZ, trxC, aceB_1, argA, modA, ybaT, ybaA, modB, phoH, rmf. From top to bottom, genes represented in E are: krtt1c19e, si:dkey-183i3.5 (thread biopolymer filament subunit alpha-like), zgc:136930 (thread biopolymer filament subunit gamma-like), cyt1, cyt1l, irg1l, si:ch211-153b23.4 (YrdC domain-containing protein-like), si:ch211-153b23.5, timp2b, mmp13a, junbb, tnfaip2b, noxo1a, zgc:111983 (mucin-like), c4b, c3a.1, mpeg1.2, si:ch211-39f2.3 (tecta-like), socs3b, tmem176l.4, zgc:174917 (phytanoyl-CoA dioxygenase domain-containing protein 1-like), lgals1l1, cebpb, mmp9, si:ch211-15b10.6 (tifa-like), fosl2, moxd1, cbln11, lect2l, cfb, steap4, irf1b, il1b, si:ch211-183d5.2 (nedd8-like), atf3, cxcl8a, si:dkey-33c14.3 (uncharacterised lincRNA), cxcl18b, cr926130.2 (uncharacterised lincRNA), socs3a, nfkbiaa, tnfrsf9a, zgc:153932 (gp2-like), sult5a1, si:dkey-239b22.1 (tecta-like), si:dkey-247k7.2, cr855311.1 (uncharacterised non-coding RNA), cp, cbx7a, c3a.6. Gene names in brackets are inferred by manual annotations based on protein alignments performed on the UniProt database (https://www.uniprot.org/). For genes not predicted to encode a protein, manual annotations were inferred from the Ensembl database (https://www.ensembl.org/). See also S1 and S2 Tables for the extended gene lists and S2 Fig for in-depth exploration of the data.

