FIGURE SUMMARY
Title

Neurons Expressing Pathological Tau Protein Trigger Dramatic Changes in Microglial Morphology and Dynamics

Authors
Hassan-Abdi, R., Brenet, A., Bennis, M., Yanicostas, C., Soussi-Yanicostas, N.
Source
Full text @ Front. Neurosci.

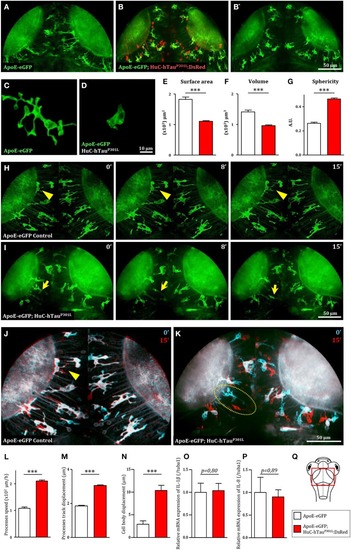
Microglia displays dramatic changes in morphology and dynamics in the presence of hTauP301L-expressing neurons. (A,B,B') Dorsal views of the optic tectum of 7 dpf Tg(ApoE-eGFP) (A) and Tg(ApoE-eGFP; HuC-hTauP301L:DsRed) transgenic embryos (B,B'), showed the characteristic ramified morphology of microglia in wild-type (A), while in the presence of hTauP301L-expressing neurons, microglial cells displayed shorter processes and larger cell bodies. (C,D) Detailed morphology of microglial cells in Tg(ApoE-eGFP) (C) and Tg(ApoE-eGFP; HuC-hTauP301L:DsRed) embryos (D). (E–G) Measurements of microglia morphological parameters; surface area (E, p < 0.0001), volume (F, p < 0.0001), and sphericity (G, p < 0.0001), in Tg(ApoE-eGFP) (n = 10) and Tg(ApoE-eGFP; HuC-hTauP301L:DsRed) (n = 24) embryos, confirmed the cell shape changes observed in the presence of hTauP301L-expressing neurons. (H,I) Time-lapse sequences of microglia dynamics in Tg(ApoE-eGFP) (H, Supplementary Video 1) and Tg(ApoE-eGFP; HuC-hTauP301L:DsRed) embryos (I, Supplementary Video 2). (J,K) Merged images of two time points separated by 15 min from Supplementary Video 1(J) and Supplementary Video 2(K). The merged images at t = 0 min (cyan) and t = 15 min (red) highlighted the dramatic increased mobility of microglial cell bodies in the presence of hTauP301L-expressing neurons. (L–N) Measurements of microglia dynamics; process speed (L, p = 0.0004), process track displacement (M, p = 0.0002) and cell body displacement (N, p = 0.0054), in Tg(ApoE-eGFP) (n = 3) and Tg(ApoE-eGFP; HuC-hTauP301L:DsRed) (n = 4) embryos, confirmed the increased mobility of both microglia processes and cell bodies observed in the presence of hTauP301L-expressing neurons. (O,P) Measurements of pro-inflammatory cytokine expression in the brain of 5 dpf Tg(ApoE-eGFP) (n = 6) and Tg(ApoE-eGFP; HuC-hTauP301L:DsRed) (n = 11) embryos. Comparison of the relative expression of IL-1β (O, p = 0.80) and IL-8 (P, p = 0.89) in both groups shows no significant differences. (Q) Schematic dorsal view of a 7 dpf zebrafish embryo. The red square shows the region of interest that comprises the optic tectum. ***p < 0.001. Scale bar (A,B,B',H–K) = 50 μm, (C,D) = 10 μm. A.U., arbitrary units.

Genetic depletion of microglia worsens the pathology in Tg(HuC-hTauP301L:DsRed) embryos. (A) Outline of microglia depletion experiments. Embryos were injected at the single cell stage with a solution of antisense morpholino oligonucleotide targeting pU.1 transcripts. At 5 dpf, injected embryos were incubated in Neutral Red solution to sort microglia-depleted embryos. (B) Dorsal views of the optic tectum of 5 dpf wild-type microglia-depleted (B2) and untreated live embryos (B1), following incubation in Neutral Red solution. (C) Dorsal views of the optic tectum of 5 dpf wild-type microglia-depleted (C2) and untreated fixed embryos (C1), labeled with L-plastin antibody. (D,E) Measurements of pro-inflammatory cytokines in the brain of 5 dpf wild-type embryos with (n = 6), or without (n = 3) microglia; and Tg(HuC-hTauP301L:DsRed) embryos with (n = 11), or without microglia (n = 7). Both relative expressions of IL-1β (D, p = 0.035) and IL-8 (E, p < 0.0001) display a significant increase in the brains of Tg(HuC-hTauP301L:DsRed) embryos without microglia cells, compared to their siblings with microglial cells. (F,G) Representative Western blots membranes of total protein extracts from 6 dpf Tg(HuC-hTauP301L:DsRed) embryos with (left) or without (right) microglia, hybridized with antibodies against human total Tau (total Tau) or human phosphorylated Tau at Ser396 residue (pTau) (F); and quantification of corresponding pTau/total Tau ratio (respectively, n = 4 and n = 4) (G, p = 0.01). The ratio of hyperphosphorylated hTau to total Tau protein is significantly increased in microglia-depleted Tg(HuC-hTauP301L:DsRed) embryos. (H–J) Dorsal views of the telencephalon of 6 dpf Tg(HuC-hTauP301L:DsRed; nlrc3-likest73/+) embryos (H) and Tg(HuC-hTauP301L:DsRed; nlrc3-likest73/73) embryos (I), labeled with an antibody directed against human phosphorylated Tau at Ser396 and Ser404 residues (PHF1); and quantification of corresponding PHF1/hTauP301L-DsRed signal ratio (respectively, n = 4 and n = 6) (J, p = 0.0485). The quantification of the signal ratio of hyperphosphorylated hTau protein on brain sections from Tg(HuC-hTauP301L:DsRed; nlrc3-likest73/73) mutant embryos devoid of microglia confirmed the significant increase of this ratio displayed in protein extracts from Tg(HuC-hTauP301L:DsRed) embryos microglia-depleted with morpholino. ***p < 0.001; **p < 0.01; *p < 0.05. Scale bar (B,C,H,I) = 50 μm.

Microglia phagocytic activity is increased in presence of hTauP301L-expressing, but appears non-sufficient in eliminating all apoptotic neurons. (A) Schematic illustration of 7 dpf embryo in dorsal view. The red square shows the region of the optic tectum where the time-lapse (B,C) was recorded. (B,C) Time-lapse imaging of a microglial cell phagocyting a diseased neuron (yellow arrowhead) in a 7 dpf Tg(ApoE-eGFP; HuC-hTauP301L:DsRed) embryo; (B, Supplementary Video 3) merge of GFP and DsRed; (C) DsRed only. (D, p = 0.0262) Quantification of the engulfed neuronal volume in Tg(ApoE-eGFP; HuC-RFP) (n = 7) and Tg(ApoE-eGFP; HuC-hTauP301L:DsRed) (n = 9) embryos, showing a significantly increased phagocytosis level by microglial cells in the presence of hTauP301L-expressing neurons. (E–H, Supplementary Video 4) Time-lapse image sequences from the optic tectum of a double transgenic Tg(ApoE-eGFP; HuC-hTauP301L:DsRed) 7 dpf embryo, showing a detail of a microglial cell in the process of phagocyting a neuron labeled with an apoptosis marker, acridine orange (merge: E, GFP and acridine: F, DsRed only: G, acridine only: H). The microglial cell filled with other dead tauopathic neurons extends its process to another dying tauopathic neuron and draws it toward its body cell to complete the phagocytosis process. (I, p = 0.027), Quantification of the number of non-engulfed apoptotic neurons in Tg(ApoE-eGFP; HuC-RFP) (n = 11) and double transgenic Tg(ApoE-eGFP; HuC-hTauP301L:DsRed) (n = 4) embryos in which there is a significantly higher number of non-engulfed apoptotic neurons. ***p < 0.001; *p < 0.05. Scale bar (B,C,E–H) = 20 μm.

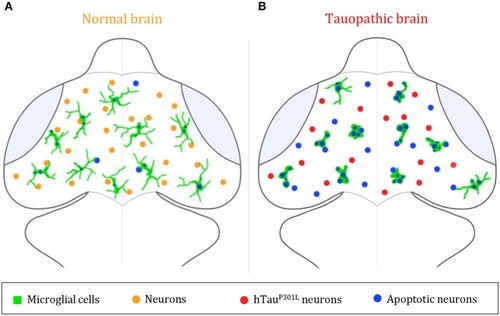
Summary illustration. (A,B) Brain illustrations of control embryo (A) and tauopathic embryo (B). In the control embryo brain, microglial cells (green) display a highly ramified morphology, allowing them to scan the brain and monitor neighboring neurons (orange) and eliminate apoptotic ones (blue). However, in presence of hTauP301L-expressing neurons (red), microglial cells (green) adopt an amoeboid morphology, that allows them to move faster throughout the brain in order to eliminate tauopathic neurons undergoing apoptosis (blue). In spite of an increased phagocytic rate of microglial cells in the tauopathic brain, there is a higher number of non-engulfed apoptotic neurons (blue), in comparison to the control brain; thus, suggesting a saturated phagocytic capacity of microglial in the tauopathic brain.

Acknowledgments
This image is the copyrighted work of the attributed author or publisher, and ZFIN has permission only to display this image to its users. Additional permissions should be obtained from the applicable author or publisher of the image. Full text @ Front. Neurosci.