FIGURE SUMMARY
Title

Anti-Hypoxic Molecular Mechanisms of Rhodiola crenulata Extract in Zebrafish as Revealed by Metabonomics

Authors
Ma, Y., Wu, Y., Xia, Z., Li, J., Li, X., Xu, P., Zhou, X., Xue, M.
Source
Full text @ Front Pharmacol

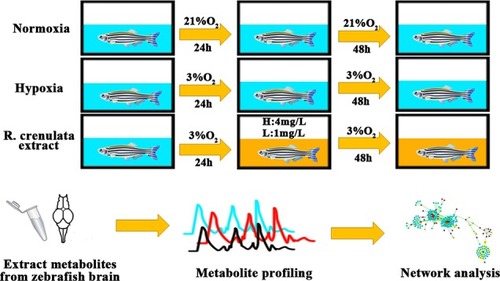
The process of zebrafish handling with different concentrations of oxygen. Background in blue indicates the normoxia or hypoxia environment and background in yellow shows RC extract treatment.

The activities of hypoxic biomarkers including (A) lactate dehydrogenase, (B) citrate synthase, and (C) hypoxia-induced factor-1α in different RC extract treatment groups under hypoxia when compared to the hypoxia and the normoxia groups. *p < 0.05, **p < 0.01, and ***p < 0.001 versus the hypoxia control group. Data are presented as the mean ± SD (n = 4).

The PCA plot among normal, hypoxia, and RC extract treatment groups. The red dash circle shows hypoxia control. Blue dash circle shows normoxia control. (A) The PCA score among normal, hypoxia and treatment after 48-h treatment. (B) The PCA score among three groups after 72-h treatment (n = 5).

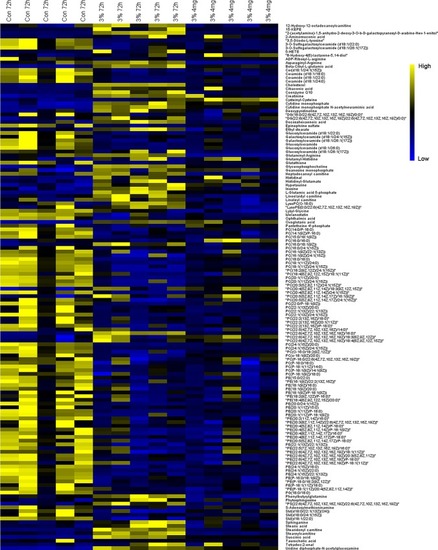
The heatmap of metabolites among normoxia, 72-h hypoxia and RC extract (4 mg/L) treatment. Metabolites labeled in yellow or blue indicate the high or low levels, respectively.

The pathway analysis of differential metabolites. The tendency of red circles shows the importance of metabolism pathway.

The analysis of protein-metabolite interaction network. Whole network (A), the molecular functions of the selected proteins (B), and the first neighbor node of proteins linking to metabolites (C) indicate the interactions between protein and metabolites. Red triangle shows differential metabolites via metabonomics and blue circle shows their interacting proteins listed in the MBRole database. Yellow circle indicated interacting proteins with metabolites straightly correlated to hypoxia. Q9UPP1: PHF8; Q9NWT6: HIF1α; Q9GZT9: EGLN1; Q96KS0: EGLN2; Q9H6Z9: EGLN3; Q9NXG6: P4HTM; Q13131: PRKAA1; P47712: PLA2G4A.

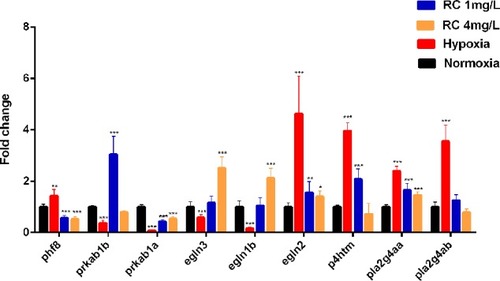
The mRNA expression of key node in zebrafish brain tissue after different RC extract treatment under hypoxia, as detected by real-time PCR. *p < 0.05, **p < 0.01, ***p < 0.001 versus hypoxia groups. Data are presented as mean ± SD (n = 6).

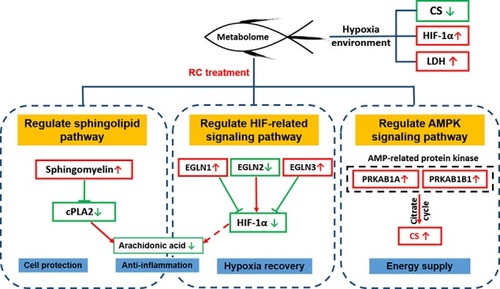
The molecular mechanisms of RC extract against hypoxia in zebrafish revealed by metabonomics and in silico network

Acknowledgments
This image is the copyrighted work of the attributed author or publisher, and ZFIN has permission only to display this image to its users. Additional permissions should be obtained from the applicable author or publisher of the image. Full text @ Front Pharmacol