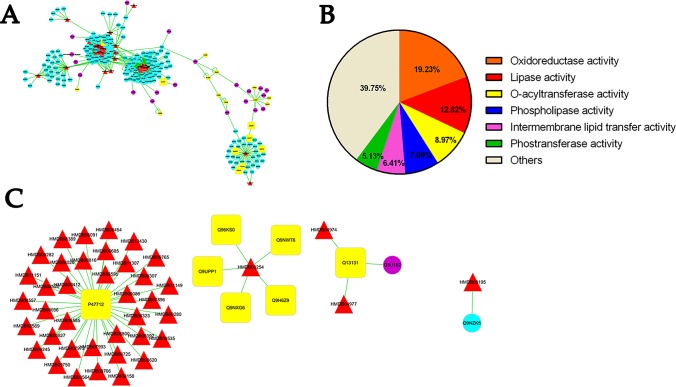
The analysis of protein-metabolite interaction network. Whole network (A), the molecular functions of the selected proteins (B), and the first neighbor node of proteins linking to metabolites (C) indicate the interactions between protein and metabolites. Red triangle shows differential metabolites via metabonomics and blue circle shows their interacting proteins listed in the MBRole database. Yellow circle indicated interacting proteins with metabolites straightly correlated to hypoxia. Q9UPP1: PHF8; Q9NWT6: HIF1α; Q9GZT9: EGLN1; Q96KS0: EGLN2; Q9H6Z9: EGLN3; Q9NXG6: P4HTM; Q13131: PRKAA1; P47712: PLA2G4A.
Acknowledgments
This image is the copyrighted work of the attributed author or publisher, and
ZFIN has permission only to display this image to its users.
Additional permissions should be obtained from the applicable author or publisher of the image.
Full text @ Front Pharmacol
Your Input Welcome
Thank you for submitting comments. Your input has been emailed to ZFIN curators who may contact you if
additional information is required.
Oops. Something went wrong. Please try again later.