
Image
|
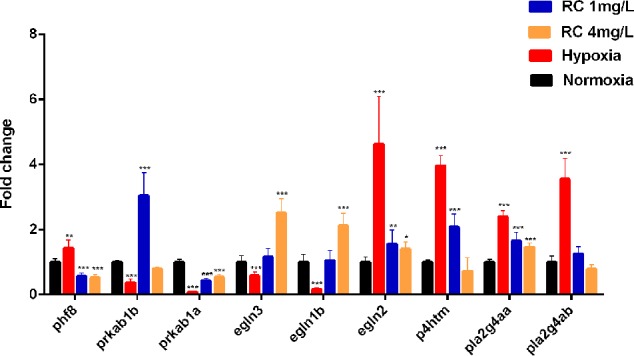
Figure Caption
Figure 7
The mRNA expression of key node in zebrafish brain tissue after different RC extract treatment under hypoxia, as detected by real-time PCR. *
Acknowledgments
This image is the copyrighted work of the attributed author or publisher, and
ZFIN has permission only to display this image to its users.
Additional permissions should be obtained from the applicable author or publisher of the image.
Full text @ Front Pharmacol