
Image
|
Figure Caption
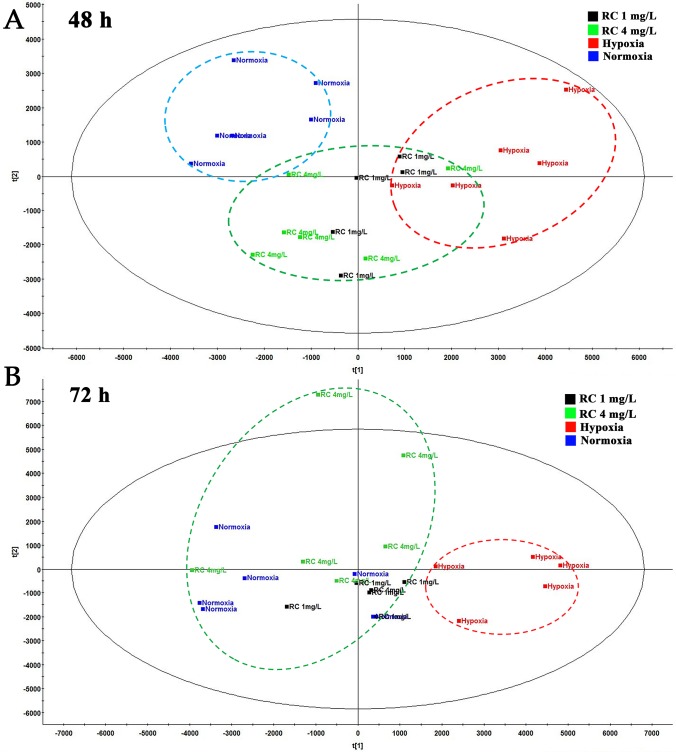
Figure 3
The PCA plot among normal, hypoxia, and RC extract treatment groups. The red dash circle shows hypoxia control. Blue dash circle shows normoxia control.
Acknowledgments
This image is the copyrighted work of the attributed author or publisher, and
ZFIN has permission only to display this image to its users.
Additional permissions should be obtained from the applicable author or publisher of the image.
Full text @ Front Pharmacol