
FIGURE
Figure 4
- ID
- ZDB-FIG-191230-638
- Publication
- Ma et al., 2019 - Anti-Hypoxic Molecular Mechanisms of Rhodiola crenulata Extract in Zebrafish as Revealed by Metabonomics
- Other Figures
- All Figure Page
- Back to All Figure Page
Figure 4
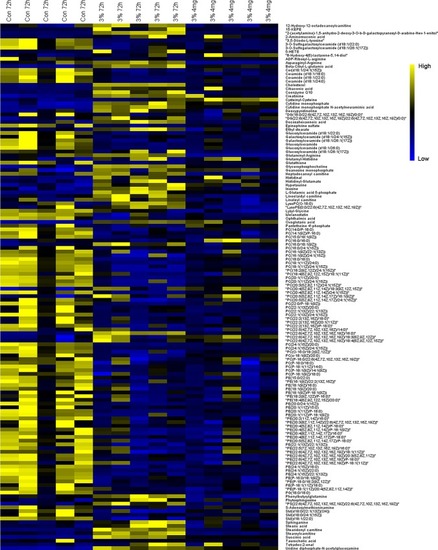
The heatmap of metabolites among normoxia, 72-h hypoxia and RC extract (4 mg/L) treatment. Metabolites labeled in yellow or blue indicate the high or low levels, respectively. |
Expression Data
Expression Detail
Antibody Labeling
Phenotype Data
Phenotype Detail
Acknowledgments
This image is the copyrighted work of the attributed author or publisher, and
ZFIN has permission only to display this image to its users.
Additional permissions should be obtained from the applicable author or publisher of the image.
Full text @ Front Pharmacol