FIGURE SUMMARY
Title

Ciglitazone-a human PPARγ agonist-disrupts dorsoventral patterning in zebrafish

Authors
Cheng, V., Dasgupta, S., Reddam, A., Volz, D.C.
Source
Full text @ Peer J.

Zebrafish and mammalian PPARs are highly conserved.

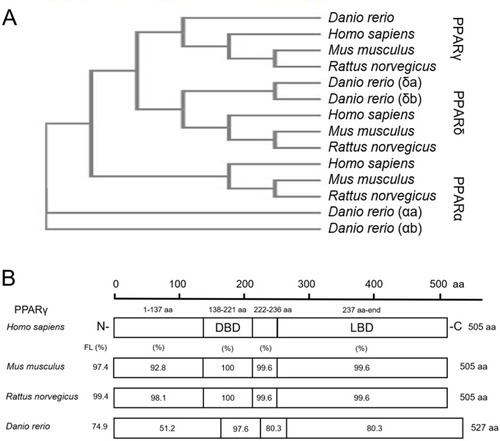
Phylogenetic tree showing relationship between Homo sapiens (human), Mus musculus (mouse), Rattus norvegicus (rat), and Danio rerio (zebrafish) PPARs (A). Percent similarity of mouse, rat, and zebrafish PPARγ relative to human PPARγ; FL, full length; DBD, DNA binding domain; and LBD, ligand binding domain (B).

Knockdown of pparγ adversely affects development within the first 96 h.

Abundance of pparγ mRNA within whole zebrafish embryos from 0.75 to 96 hpf (A). Confirmation of knockdown by 24 hpf following injection of splice-blocking pparγ-MOs. Lanes 1–3: 6-hpf embryos injected with nc-MO; lanes 4–6: 6-hpf embryos injected with pparγ-MO; lanes 7–9: 24-hpf embryos injected with nc-MO; and lanes 10–12: 24-hpf embryos injected with pparγ-MO (B). Representative images of water-, nc-MO-, or pparγ-MO-injected embryos from 6 to 96 hpf before and after staining with Oil Red O (ORO) (C–FF). Arrows point to mild dorsoventral patterning defects (ventralization), whereas arrowheads point to cardiac edema and cardiac looping defects.

EXPRESSION / LABELING:
Gene:
Fish:
Anatomical Term:
Stage Range: 1-cell to Day 4
PHENOTYPE:
Fish:
Knockdown Reagent:
Observed In:
Stage Range: Prim-5 to Day 4

Initiation of ciglitazone exposure at 4 hpf results in dorsoventral patterning defects by 24 hpf.

Initiation of ciglitazone (Cig) exposure at 4 hpf does not result in delayed epiboly by 6 hpf (N = 60 embryos per treatment) (A). Mean (± standard deviation) percent of normal, ventralized, dorsalized, or dead embryos following exposure to increasing concentrations of Cig from 4 to 24 hpf (N = 60 embryos per treatment) (B). Asterisk (*) denotes a significant difference (p < 0.05) in the percent of normal embryos relative to vehicle controls (0.2% DMSO). Representative images of (1) a normal embryo exposed to vehicle (0.2% DMSO) (C); (2) ventralized embryos exposed to 9.375 and 12.5 μM Cig (D and E); and (3) a delayed embryo exposed to 15 µM Cig (F). Arrows point to swollen yolk sac extensions, whereas arrowheads point to underdeveloped heads.

Knockdown of pparγ does not block ciglitazone-induced toxicity at 24 hpf.

Mean (± standard deviation) percent of normal, ventralized, delayed, or dead embryos following injection of nc-MOs or pparγ-MOs at 0.75 hpf and exposure from 4 to 24 hpf to vehicle (0.2% DMSO) or 12.5 µM ciglitazone (Cig) (N = 60 embryos per treatment). Asterisk (*) denotes a significant difference (p < 0.05) in the percent of normal embryos relative to within-treatment water-injected controls (p < 0.05). Cross (†) denotes a significant difference (p < 0.05) in the percent of normal embryos relative to within-MO vehicle (0.2% DMSO) controls. chd-MO was used as a positive control for ventralization (A). Representative images of nc-MO- and pparγ-MO-injected embryos exposed to either vehicle (0.2% DMSO) or 12.5 µM Cig at 24 hpf (B–G).

DMP reverses the ventralizing effects of ciglitazone.

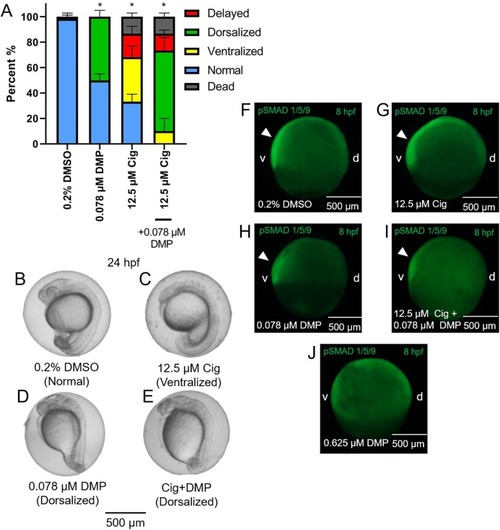
Mean (+standard deviation) percent of normal, ventralized, dorsalized, delayed, or dead embryos following exposure to vehicle (0.2% DMSO), 0.078 µM DMP, 12.5 µM ciglitazone (Cig), or 0.078 µM DMP + 12.5 µM Cig (N = 60 embryos per treatment) (A). Asterisk (*) denotes a significant difference (p < 0.05) in the percent of normal embryos relative to vehicle (0.2% DMSO) controls. Representative images of embryos following exposure to vehicle (0.2% DMSO), 0.078 µM DMP, 12.5 µM ciglitazone, or 0.078 µM DMP + 12.5 µM Cig (B–E). Immunostaining with anti-phosphoSMAD-1/5/9 within 8-hpf embryos following exposure to vehicle (0.2% DMSO), 0.078 µM DMP, 12.5 µM Cig, or 0.078 µM DMP + 12.5 µM Cig; embryos exposed to 0.625 µM DMP were included as a positive control for disruption of BMP signaling gradients. Arrowheads point to elevated pSMAD 1/5/9 staining on the ventral side of the embryo (F–J).

Exposure to ciglitazone, DMP, or ciglitazone + DMP results in significant effects on the transcriptome at 24 hpf.

Volcano plots showing the number of significantly different transcripts following exposure to 12.5 µM ciglitazone (Cig) (A), 0.078 µM DMP (B), or 0.078 µM DMP + 12.5 µM Cig (C). All data are relative to vehicle (0.2% DMSO) controls. Log2 transformed fold change is plotted on the x-axis and log10 transformed p-adjusted value is plotted on the y-axis. Venn diagram showing the number and percent of significantly different overlapping transcripts among treatment groups; percentage values are relative to the total number of significantly different transcripts across all treatment groups (D).

Ciglitazone exposure impacts cholesterol- and lipid-related biological processes by 24 hpf.

Top 5 DAVID-identified biological processes (based on significantly different transcripts) following exposure to 12.5 µM ciglitazone, 0.078 µM DMP, or 0.078 µM DMP + 12.5 µM ciglitazone (A). Venn diagram showing the number and percent of significantly altered biological processes among treatment groups (B). Significant (Benjamini < 0.05) biological processes unique to each treatment group (C).

Acknowledgments
This image is the copyrighted work of the attributed author or publisher, and ZFIN has permission only to display this image to its users. Additional permissions should be obtained from the applicable author or publisher of the image. Full text @ Peer J.