
Image
|
Figure Caption
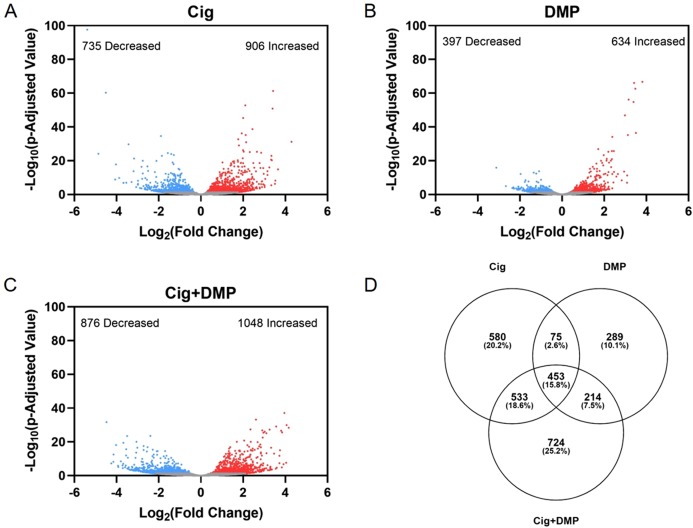
Figure 6
Volcano plots showing the number of significantly different transcripts following exposure to 12.5 µM ciglitazone (Cig) (A), 0.078 µM DMP (B), or 0.078 µM DMP + 12.5 µM Cig (C). All data are relative to vehicle (0.2% DMSO) controls. Log2 transformed fold change is plotted on the
Acknowledgments
This image is the copyrighted work of the attributed author or publisher, and
ZFIN has permission only to display this image to its users.
Additional permissions should be obtained from the applicable author or publisher of the image.
Full text @ Peer J.