FIGURE SUMMARY
Title

SPLICS: a split green fluorescent protein-based contact site sensor for narrow and wide heterotypic organelle juxtaposition

Authors
Cieri, D., Vicario, M., Giacomello, M., Vallese, F., Filadi, R., Wagner, T., Pozzan, T., Pizzo, P., Scorrano, L., Brini, M., Calì, T.
Source
Full text @ Cell Death Differ.

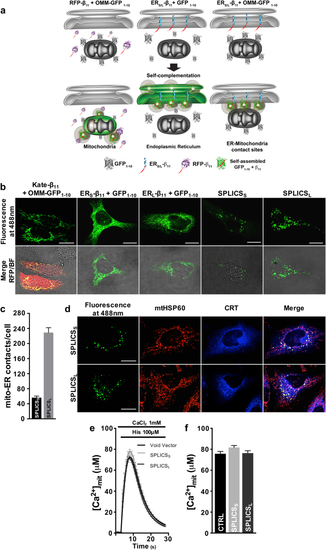
Functional characterization of the SPLICS probes. a Cartoon showing the general approach used to design the SPLICS. The mitochondrial network, the ER network, and the ER–mitochondria contact sites are revealed by co-expression of the β11-tagged cytosolic RFP (Kate) and the OMM-GFP1–10 (left panel), of the ERS/L11 constructs and a cytosolic GFP1–10 (middle panel) and of the SPLICSS/L (right panel), respectively. b Experimental controls showing the correct targeting of the mitochondrial (OMM-GFP1–10) and the ER (ERS11 and ERL11) targeted fragments verified by complementation with Kate-β11 and GFP1–10, respectively. Co-transfection of HeLa cells with OMM-GFP1–10 and both ERS11 or ERL11 induces the appearance of a “dotted” fluorescence. c Quantification of ER–mitochondria contacts in HeLa cells. The SPLICS dots were quantified from the 3D rendering of a complete z-stack. Mean ± SEM: SPLICSS 56 ± 4, n = 37 cells; SPLICSL 229 ± 12, n = 25 cells. d Co-localization of SPLICSS/L fluorescence with mitochondria (mtHSP60) and ER (CRT: calreticulin) markers. Representative traces e and statistical analysis f of mitochondrial Ca2+ uptake in HeLa cells transfected with SPLICSS or SPLICSL along with mtAeqmut. Mean ± SEM: Void Vector 75 ± 2, n = 65 wells; SPLICSS 77 ± 1, n = 54 wells; SPLICSL 71 ± 2, n = 54 wells. Scale bar 15 µm. Data shown are the result of 3–5 independent experiments.

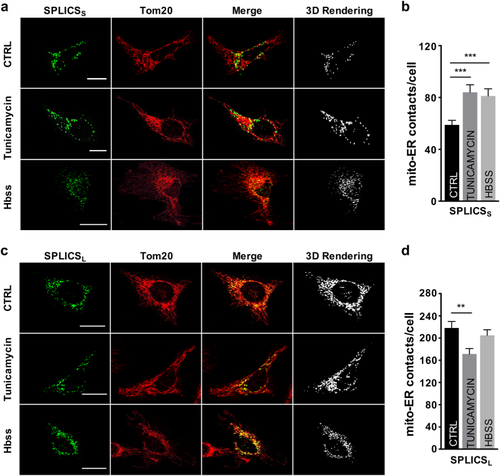
Effect of Tunicamycin and Hbss treatment on ER–mitochondria contacts. Immunofluorescence against mitochondria (Tom20, red) is shown in the panels on the middle. The green channel is the merge of several planes. Scale bar 20 µm. a Representative confocal pictures of HeLa cells expressing the SPLICSS probe. b Quantification of SPLICSS contacts by 3D rendering of complete z-stacks. Mean ± SEM: Ctrl 58 ± 3, n = 32 cells; Tunicamycin 84 ± 5, n = 33 cells; Hbss 81 ± 5, n = 25 cells. c Representative confocal pictures of HeLa cells expressing the SPLICSL probe. d Quantification of SPLICSL contacts by 3D rendering of complete z-stacks. Mean ± SEM: Ctrl 218 ± 11, n = 27 cells; Tunicamycin 171 ± 9, n = 33 cells; Hbss 204 ± 10, n = 23 cells. Data shown are the result of three independent experiments. **p ≤ 0.01, ***p ≤ 0.001.

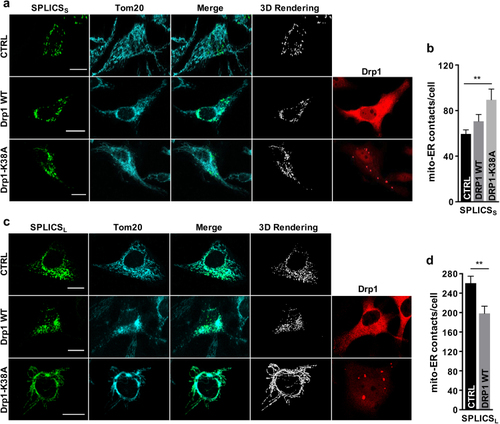
Effects of Drp1 overexpression on ER–mitochondria contacts. Immunofluorescence against mitochondria (Tom20, cyan) and Drp1 (red) is shown in the corresponding panels. The green channel is the merge of several planes. Scale bar 20 µm. a Representative confocal pictures of HeLa cells expressing the SPLICSS probe. b Quantification of SPLICSS contacts by 3D rendering of complete z-stacks. Mean ± SEM: Ctrl 59 ± 3, n = 79 cells; Drp1 WT 70 ± 5, n = 32 cells; Drp1-K38A 89 ± 9, n = 28 cells. c Representative confocal pictures of HeLa cells expressing the SPLICSL probe. d Quantification of SPLICSL contacts by 3D rendering of complete z-stacks. Mean ± SEM: Ctrl 260 ± 14, n = 24 cells; Drp1 WT 198 ± 14, n = 24 cells. Data shown are the result of 3–4 independent experiments. **p ≤ 0.01.

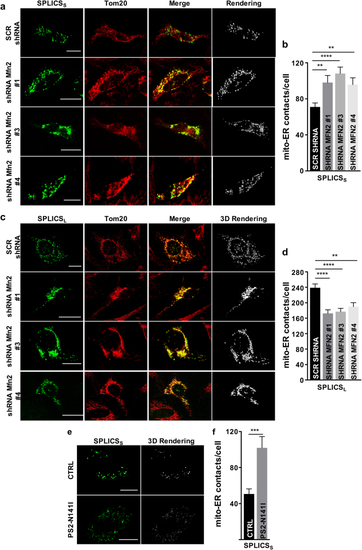
Effect of Mfn2 knockdown and mutant PS2 on ER–mitochondria interface. Immunofluorescence against mitochondria (Tom20, red) is shown in the panels on the middle. The green channel is the merge of several planes. Scale bar 20 µm. a Representative confocal pictures of HeLa cells expressing the SPLICSS probe. b Quantification of SPLICSS contacts by 3D rendering of complete z-stacks. Mean ± SEM: SCR shRNA 70 ± 4, n = 76 cells; shRNA Mfn2 #1 98 ± 7, n = 26 cells; shRNA Mfn2 #3 108 ± 7, n = 28 cells; shRNA Mfn2 #4: 95 ± 7, n = 23 cells. c Representative confocal pictures of HeLa cells expressing the SPLICSL probe. d Quantification of SPLICSL contacts by 3D rendering of complete z-stacks. Mean ± SEM: SCR shRNA 238 ± 10, n = 30 cells; shRNA Mfn2 #1 172 ± 9, n = 27 cells; shRNA Mfn2 #3 176 ± 8, n = 29 cells; shRNA Mfn2 #4 190 ± 10, n = 27 cells. e Representative confocal pictures of human fibroblasts from a patient with the N141I mutation in PS2 (bottom panel) and an age-matched control (upper panel) expressing the SPLICSS probe. The green channel is the merge of several planes. Scale bar 20 µm. f Quantification of ER–mitochondria short contacts by 3D rendering of complete z-stacks. Mean ± SEM: CTRL 50 ± 5, n = 20 cells; PS2-N14I: 101 ± 12, n = 21 cells. Data shown are the result of 2–5 independent experiments. **p ≤ 0.01, ***p ≤ 0.001, ****p ≤ 0.0001.

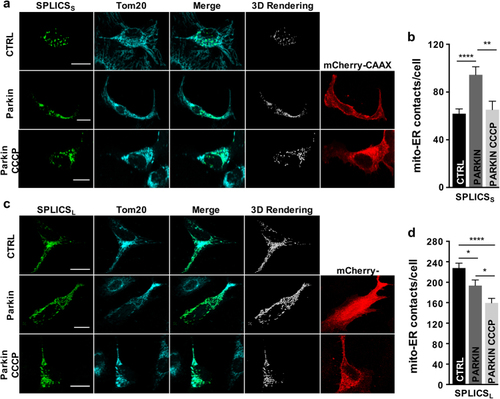
Effects of Parkin on ER–mitochondria contacts. Immunofluorescence against mitochondria (Tom20, cyan) is shown in the panels on the middle. The green channel is the merge of several planes. Scale bar 20 µm. a Representative confocal pictures of HeLa cells expressing the SPLICSS probe along with Parkin-2A-mCherry-CAAX (bottom panels). b Quantification of SPLICSS contacts by 3D rendering of complete z-stacks. Mean ± SEM: Ctrl 61 ± 3, n = 57 cells; Parkin 94 ± 6, n = 33 cells; Parkin CCCP 65 ± 7, n = 26 cells. c Representative confocal pictures of HeLa cells expressing the SPLICSL probe along with Parkin-2A-mCherry-CAAX (bottom panels). d Quantification of the SPLICSL contacts by 3D rendering of complete z-stacks. Mean ± SEM: CTRL 227 ± 9, n = 44 cells; Parkin 193 ± 11, n = 32 cells; Parkin CCCP 159 ± 8, n = 22 cells. Data shown are the result of 3–8 independent experiments. *p ≤ 0.05, **p ≤ 0.01, ****p ≤ 0.0001.

Expression of the SPLICSS probe in living zebrafish embryos. a Schematic depiction of the bidirectional construct that allows detection of DsRed and SPLICSS-P2A in a Gal4-dependent manner. The 2A peptide guarantees the generation of an equimolar amount of the two spGFP fragments. b Experimental setting used to image ER–mitochondria contacts in zebrafish embryos: a schematic drawing of RB neurons is shown on the right. c Representative image of a 1 dpf s1102t:GAL4 embryo injected with the pT2-DsRed-UAS-SPLICSS-P2A construct. d Live imaging of short ER–mitochondria contacts in RB neurons of s1102t:GAL4 zebrafish embryos. The picture is the merge of several planes. The 3D rendering of the z-stack is shown on the right. Scale bar: 15 µm. e Quantification of SPLICSS contacts in the cell body of RB neurons by 3D rendering of complete z-stacks. Mean ± SEM: 22 ± 1, n = 28 cells from 11 fish. f Live imaging of SPLICSS contacts in the axons of RB neurons. The picture is the merge of several planes. The 3D rendering of the complete z-stack is shown on the right. Scale bar: 15 µm. g Quantification of the density of SPLICSS contacts in the cell body and the axons of RB neurons. Mean ± SEM: RB soma: 0.17 ± 0.01, n = 28 cells from 11 fish; RB axon: 0.14 ± 0.01, n = 20 cells from 6 fish. Data shown are the result of two independent experiments.

Acknowledgments
This image is the copyrighted work of the attributed author or publisher, and ZFIN has permission only to display this image to its users. Additional permissions should be obtained from the applicable author or publisher of the image. Full text @ Cell Death Differ.