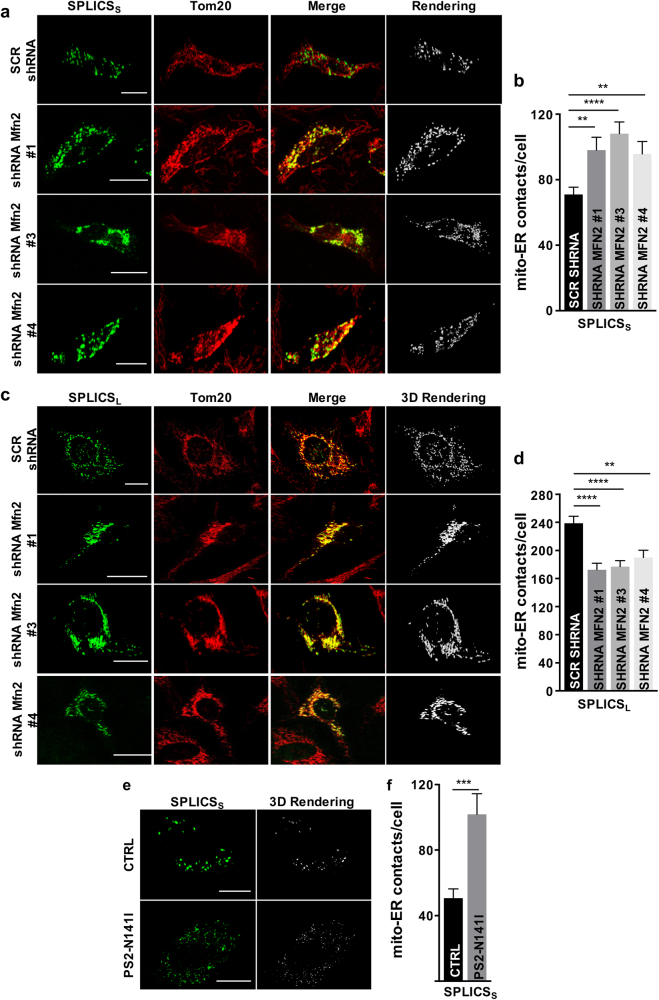
IMAGE

Fig. 4

ID
ZDB-IMAGE-191230-266
Source
Figures for Cieri et al., 2018
Image
Figure Caption

Fig. 4

Effect of Mfn2 knockdown and mutant PS2 on ER–mitochondria interface. Immunofluorescence against mitochondria (Tom20, red) is shown in the panels on the middle. The green channel is the merge of several planes. Scale bar 20 µm. a Representative confocal pictures of HeLa cells expressing the SPLICSS probe. b Quantification of SPLICSS contacts by 3D rendering of complete z-stacks. Mean ± SEM: SCR shRNA 70 ± 4, n = 76 cells; shRNA Mfn2 #1 98 ± 7, n = 26 cells; shRNA Mfn2 #3 108 ± 7, n = 28 cells; shRNA Mfn2 #4: 95 ± 7, n = 23 cells. c Representative confocal pictures of HeLa cells expressing the SPLICSL probe. d Quantification of SPLICSL contacts by 3D rendering of complete z-stacks. Mean ± SEM: SCR shRNA 238 ± 10, n = 30 cells; shRNA Mfn2 #1 172 ± 9, n = 27 cells; shRNA Mfn2 #3 176 ± 8, n = 29 cells; shRNA Mfn2 #4 190 ± 10, n = 27 cells. e Representative confocal pictures of human fibroblasts from a patient with the N141I mutation in PS2 (bottom panel) and an age-matched control (upper panel) expressing the SPLICSS probe. The green channel is the merge of several planes. Scale bar 20 µm. f Quantification of ER–mitochondria short contacts by 3D rendering of complete z-stacks. Mean ± SEM: CTRL 50 ± 5, n = 20 cells; PS2-N14I: 101 ± 12, n = 21 cells. Data shown are the result of 2–5 independent experiments. **p ≤ 0.01, ***p ≤ 0.001, ****p ≤ 0.0001.

Acknowledgments
This image is the copyrighted work of the attributed author or publisher, and ZFIN has permission only to display this image to its users. Additional permissions should be obtained from the applicable author or publisher of the image. Full text @ Cell Death Differ.