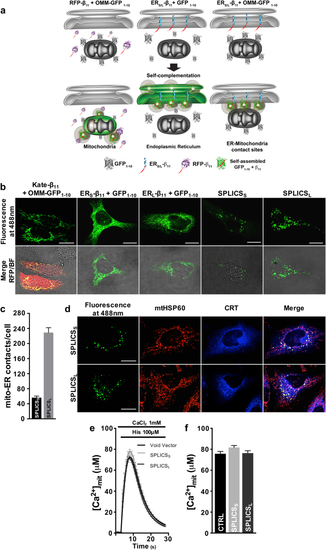
Functional characterization of the SPLICS probes. a Cartoon showing the general approach used to design the SPLICS. The mitochondrial network, the ER network, and the ER–mitochondria contact sites are revealed by co-expression of the β11-tagged cytosolic RFP (Kate) and the OMM-GFP1–10 (left panel), of the ERS/L-β11 constructs and a cytosolic GFP1–10 (middle panel) and of the SPLICSS/L (right panel), respectively. b Experimental controls showing the correct targeting of the mitochondrial (OMM-GFP1–10) and the ER (ERS-β11 and ERL-β11) targeted fragments verified by complementation with Kate-β11 and GFP1–10, respectively. Co-transfection of HeLa cells with OMM-GFP1–10 and both ERS-β11 or ERL-β11 induces the appearance of a “dotted” fluorescence. c Quantification of ER–mitochondria contacts in HeLa cells. The SPLICS dots were quantified from the 3D rendering of a complete z-stack. Mean ± SEM: SPLICSS 56 ± 4, n = 37 cells; SPLICSL 229 ± 12, n = 25 cells. d Co-localization of SPLICSS/L fluorescence with mitochondria (mtHSP60) and ER (CRT: calreticulin) markers. Representative traces e and statistical analysis f of mitochondrial Ca2+ uptake in HeLa cells transfected with SPLICSS or SPLICSL along with mtAeqmut. Mean ± SEM: Void Vector 75 ± 2, n = 65 wells; SPLICSS 77 ± 1, n = 54 wells; SPLICSL 71 ± 2, n = 54 wells. Scale bar 15 µm. Data shown are the result of 3–5 independent experiments.
|
