FIGURE

Fig. 5

ID
ZDB-FIG-191230-250
Publication
Cieri et al., 2018 - SPLICS: a split green fluorescent protein-based contact site sensor for narrow and wide heterotypic organelle juxtaposition
Other Figures
All Figure Page
Back to All Figure Page
Fig. 5

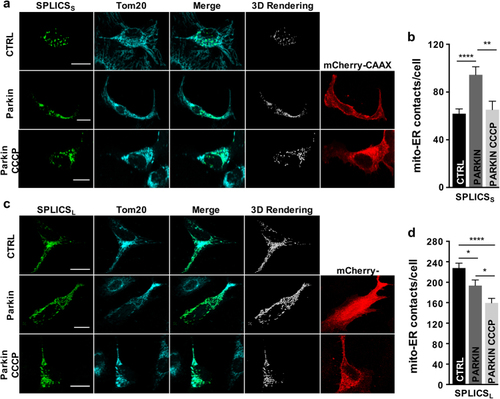
Effects of Parkin on ER–mitochondria contacts. Immunofluorescence against mitochondria (Tom20, cyan) is shown in the panels on the middle. The green channel is the merge of several planes. Scale bar 20 µm. a Representative confocal pictures of HeLa cells expressing the SPLICSS probe along with Parkin-2A-mCherry-CAAX (bottom panels). b Quantification of SPLICSS contacts by 3D rendering of complete z-stacks. Mean ± SEM: Ctrl 61 ± 3, n = 57 cells; Parkin 94 ± 6, n = 33 cells; Parkin CCCP 65 ± 7, n = 26 cells. c Representative confocal pictures of HeLa cells expressing the SPLICSL probe along with Parkin-2A-mCherry-CAAX (bottom panels). d Quantification of the SPLICSL contacts by 3D rendering of complete z-stacks. Mean ± SEM: CTRL 227 ± 9, n = 44 cells; Parkin 193 ± 11, n = 32 cells; Parkin CCCP 159 ± 8, n = 22 cells. Data shown are the result of 3–8 independent experiments. *p ≤ 0.05, **p ≤ 0.01, ****p ≤ 0.0001.

Expression Data

Expression Detail
Antibody Labeling
Phenotype Data

Phenotype Detail
Acknowledgments
This image is the copyrighted work of the attributed author or publisher, and ZFIN has permission only to display this image to its users. Additional permissions should be obtained from the applicable author or publisher of the image. Full text @ Cell Death Differ.