
- Title
-
Zebrafish preserve global germline DNA methylation while sex-linked rDNA is amplified and demethylated during feminisation
- Authors
- Ortega-Recalde, O., Day, R.C., Gemmell, N.J., Hore, T.A.
- Source
- Full text @ Nat. Commun.

Isolation and quantitation of DNA methylation in the zebrafish germline. a–d Fluorescence microscopy of tg(vasa:EGFP) zebrafish embryos and larvae. 1.5 h post-fertilisation (hpf) (a), 24 hpf (b), 48 hpf (c–d). 1.8× view of EGFP +ve labelled cells is shown inset (dashed lines). Scale bars are 500 µm. Forward scatter height (FSC-H) e Flow cytometry plot of 10 zebrafish larvae at 48 hpf. The red dashed square indicates the EGFP +ve population gated for isolation. Blue dots indicate discrete data points (i.e., cellular events), whereas green, yellow and red colouring indicate increasing data density. f Percentage of methylation in CG context from 1 to 28 days post-fertilisation (dpf) in both vasa:EGFP +ve germline cells (green line) and control cells (black line). For each sample type and timepoint, n = 3 independent biological replicates were used, except for 28 dpf vasa:EGFP +ve, which has n = 5 independent biological replicates |
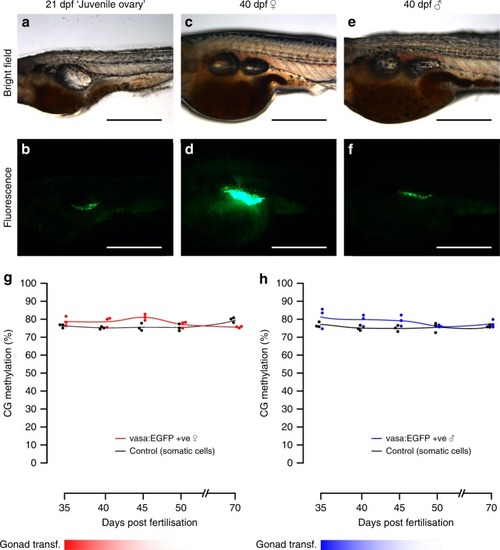
Fluorescence microscopy of germline cells and their methylation during gonad transformation. a–f Phenotypic sex in zebrafish can be identified using vasa:EGFP expression: during the ‘juvenile ovary’ stage, expression of EGFP is low but consistent between individuals (a, b). Later, expression of EGFP vastly increases in presumptive females (c, d) relative to presumptive males (e, f). This enables sex phenotyping in early stages of sexual differentiation. Scale bars are 500 µm. g, h Methylation in the vasa:EGFP +ve germline cells of female (g) and male (h) fish from the gonad transformation stage until sexual maturity (35–70 dpf). Non-germline control cells were also tested (black lines and dots). For each sample type and timepoint, n = 3 independent biological replicates were used |