
|
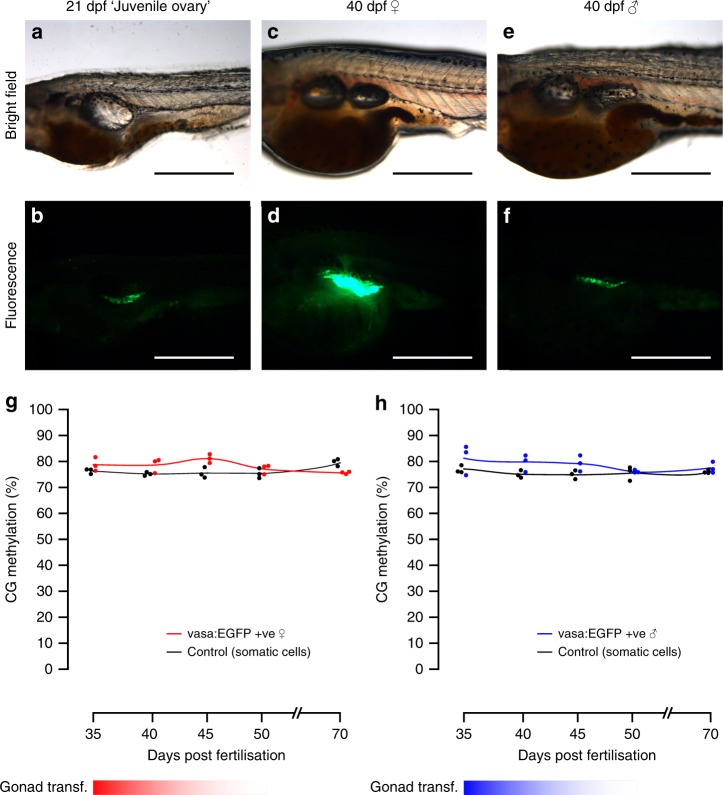
Fig. 2
Fluorescence microscopy of germline cells and their methylation during gonad transformation. a–f Phenotypic sex in zebrafish can be identified using vasa:EGFP expression: during the ‘juvenile ovary’ stage, expression of EGFP is low but consistent between individuals (a, b). Later, expression of EGFP vastly increases in presumptive females (c, d) relative to presumptive males (e, f). This enables sex phenotyping in early stages of sexual differentiation. Scale bars are 500 µm. g, h Methylation in the vasa:EGFP +ve germline cells of female (g) and male (h) fish from the gonad transformation stage until sexual maturity (35–70 dpf). Non-germline control cells were also tested (black lines and dots). For each sample type and timepoint, n = 3 independent biological replicates were used