FIGURE SUMMARY
Title

Intravital Imaging Reveals Divergent Cytokine and Cellular Immune Responses to Candida albicans and Candida parapsilosis

Authors
Archambault, L.S., Trzilova, D., Gonia, S., Gale, C., Wheeler, R.T.
Source
Full text @ MBio

C. albicans (C.a.) is more virulent than C. parapsilosis (C.p.) in the zebrafish swimbladder infection model. (A) Zebrafish were infected in the swimbladder at 4 days postfertilization (dpf) with 50 to 100 yeast cells. (B) Candida burden at 24 h postinfection (hpi) quantified from confocal z-projections. Data were pooled from 4 experiments. (C to F) Examples of infected swimbladders in Tg(mpx:mCherry):uwm7Tg zebrafish infected with C. parapsilosis (C and D) or C. albicans (E and F). Depicted are normal appearance of swimbladder (6 hpi) (C), partial swimbladder deflation (24 hpi) (D), complete deflation (24 hpi) (E), and distended swimbladder (24 hpi) (F). Bars, 150 μm. The dotted white line indicates the boundary of the swimbladder. (G) Injected fish were monitored for survival for 4 dpi. Data were pooled from 3 independent experiments. Statistics are described in Materials and Methods (*, P ≤ 0.05; **, P ≤ 0.01). Veh, vehicle.

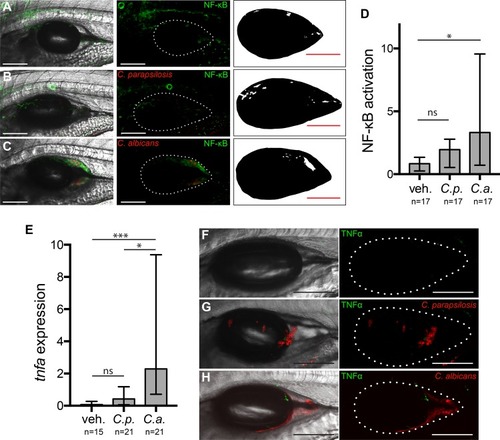
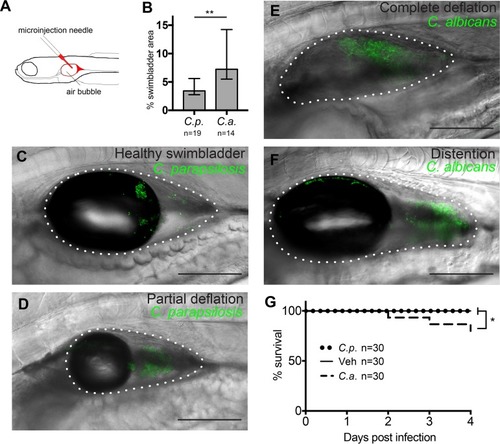
Transcription factor NF-κB is activated and proinflammatory cytokine TNF-α is expressed during C. albicans but not C. parapsilosis infection. Transgenic Tg(NF-κB:EGFP) zebrafish were infected and imaged as described in the legend of Fig. 1. (A to C) Images representing the median levels of NF-κB activation for vehicle (A), C. parapsilosis (B), and C. albicans (C) injections. Panels A to C show maximum projections of 12 z-slices. (Left) Overlay of fluorescence and differential interference contrast (DIC); (middle) overlay of fluorescence with a dotted outline of the swimbladder; (right) thresholded image for quantification. (D) Quantification of NF-κB activation. Data are from 3 independent experiments. (E to H) TgBAC(tnfa:GFP) reporter fish were infected and imaged at 24 hpi as described above. (E) Quantification of TNF-α expression. Data are from 3 independent experiments. (F to H) Representative images of swimbladders. Median levels of TNF-α expression are shown for the vehicle control (F) and C. parapsilosis (G) and C. albicans (H) infections. (Left) Maximum projections of 15 to 18 z-slices; (right) dotted outline of swimbladder. All bars, 150 μm. Statistics are described in Materials and Methods (*, P ≤ 0.05; **, P ≤ 0.01; ***, P ≤ 0.001; ns, not significant [P > 0.05]).

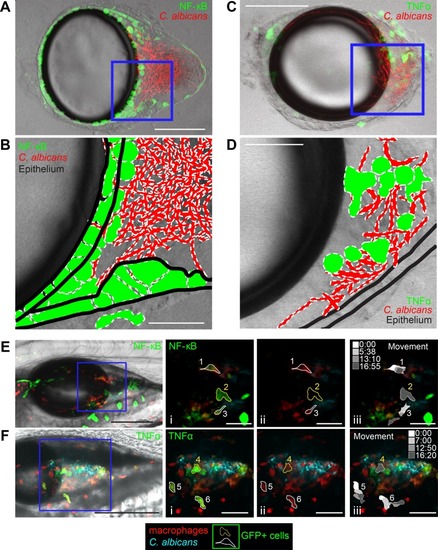
Patterns of NF-κB activation and TNF-α expression differ. Dissected swimbladders from C. albicans-infected fish were imaged at 24 hpi. (A) z-projection of 3 slices of a dissected Tg(NF-κB:EGFP) swimbladder with moderate EGFP expression. (B) Single z-slice from the blue square in the z-stack in panel A, with outlines of fungi, EGFP+ cells, and epithelial layers based on the DIC image. (C) z-projection of 7 slices of a TgBAC(tnfa:GFP) swimbladder with high GFP expression levels. (D) Single z-slice from the blue square in the z-stack in panel A, with outlines of fungi, GFP+ cells, and epithelial layers based on the DIC image. (E and F) Still images from time-lapse images taken at 24 hpi. (E) Tg(NF-κB:EGFP) × mpeg1:dTomato (red macrophage) zebrafish at time 0:00 of the time-lapse image in Movie S1 in the supplemental material. The leftmost image is a maximum-projection overlay of all colors using a middle plane from the DIC image. (i) Zoomed-in images of the areas outlined in the blue square. Dotted lines outline example cells that either moved (white outlines [cells 1 and 3]) or remained stationary (yellow outlines [cell 2]) over the 16-min-long time-lapse experiment. (ii) The GFP channel was eliminated to demonstrate red fluorescence of macrophages. Cells 1 and 3 are dTomato+ (macrophages), while cell 2 is not. (iii) Schematics showing the positions of each cell at the times indicated in the grayscale legend. Only cells 1 and 3 change shape or position. (F) TgBAC(tnfa:GFP) × mpeg1:dTomato zebrafish at time 0:00 of the time-lapse imaging in Movie S2. (i) Outlines of example cells (white, moved [cells 5 and 6]; yellow, stationary [cell 4]). (ii) Cells 4, 5, and 6 are dTomato+ (macrophages). (iii) Schematics showing movement over time. Cells 5 and 6 change shape and position over the course of the time-lapse experiment, but cell 4 does not. Color channels show z-projections of 13 slices (E) or 11 slices (F). DIC was performed for a single z-slice. Bars, 150 μm (A, C, E, and F) and 50 μm (B, D, Ei to Eiii, and Fi to Fiii).

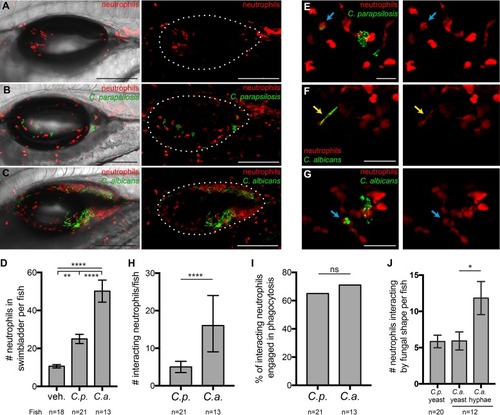
Neutrophils respond to infections with both
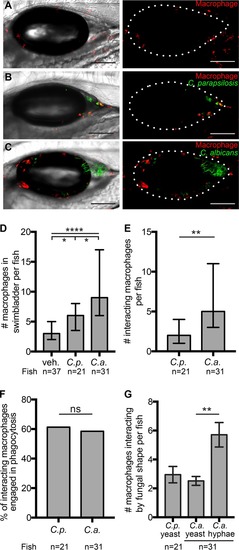
 Candida species. Tg(mpx:mCherry):uwm7Tg zebrafish (red neutrophils) were infected as described in the legend of Fig. 1 and imaged at 24 hpi. Data are pooled from 5 independent experiments. (A to C) Representative images from vehicle (A), C. parapsilosis (B), and C. albicans (C) cohorts. Maximum projections of 19 z-slices (A), 18 z-slices (B), and 16 z-slices (C), with (left) and without (right) a single DIC z-slice, are shown. (D) Neutrophils per fish in the swimbladder lumen at 24 hpi. (E to G) Examples of neutrophils (red) interacting with C. parapsilosis (green) (E) or C. albicans (green) (F and G). Interactions include contact, phagocytosis (E and G, blue arrows), and “frustrated phagocytosis” (F, yellow arrows). Maximum projections of 3 slices (E and F) and 9 slices (G) are shown. (H) Numbers of neutrophils per fish involved in interactions with C. parapsilosis or C. albicans at 24 hpi. (I) Percentages of interacting neutrophils engaged in phagocytosis at 24 hpi. (J) Numbers of neutrophils per fish interacting with yeast of C. parapsilosis and yeast or hyphae of C. albicans. Numbers of neutrophils scored for the vehicle, C. parapsilosis, and C. albicans were 191, 525, and 652, respectively. Statistics are described in Materials and Methods (*, P ≤ 0.05; **, P ≤ 0.01; ***, P ≤ 0.001; ****, P ≤ 0.0001; ns, not significant [P > 0.05]). Bars, 150 μm (A to C) and 40 μm (E to G).

Both C. albicans and C. parapsilosis elicit macrophage recruitment. Transgenic mpeg1:GAL4/UAS:nfsB-mCherry zebrafish (red macrophages) were infected and imaged at 24 hpi. (A to C) Representative images of zebrafish swimbladders injected with the vehicle (A), C. parapsilosis (B), and C. albicans (C). Maximum projections of 16 slices (A) and 13 slices (B and C), with (left) and without (right) a single DIC z-slice, are shown. (D) Numbers of macrophages per fish in the swimbladder lumen. Data were pooled from 7 independent experiments. (E) Numbers of macrophages per fish involved in interactions with C. parapsilosis or C. albicans. (F) Percentages of interacting macrophages engaged in phagocytosis. (G) Numbers of macrophages per fish interacting with fungi. Numbers of macrophages scored for the vehicle, C. parapsilosis, and C. albicans were 137, 135, and 367, respectively. Statistics are described in Materials and Methods (*, P ≤ 0.05; **, P ≤ 0.01; ***, P ≤ 0.001; ****, P ≤ 0.0001; ns, not significant [P > 0.05]). Bars, 150 μm (A to C).

Acknowledgments
This image is the copyrighted work of the attributed author or publisher, and ZFIN has permission only to display this image to its users. Additional permissions should be obtained from the applicable author or publisher of the image. Full text @ MBio