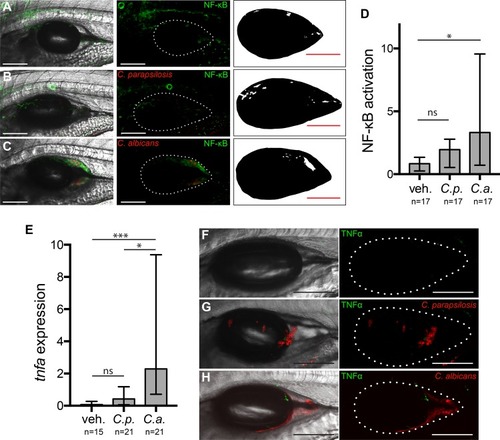
Transcription factor NF-κB is activated and proinflammatory cytokine TNF-α is expressed during C. albicans but not C. parapsilosis infection. Transgenic Tg(NF-κB:EGFP) zebrafish were infected and imaged as described in the legend of Fig. 1. (A to C) Images representing the median levels of NF-κB activation for vehicle (A), C. parapsilosis (B), and C. albicans (C) injections. Panels A to C show maximum projections of 12 z-slices. (Left) Overlay of fluorescence and differential interference contrast (DIC); (middle) overlay of fluorescence with a dotted outline of the swimbladder; (right) thresholded image for quantification. (D) Quantification of NF-κB activation. Data are from 3 independent experiments. (E to H) TgBAC(tnfa:GFP) reporter fish were infected and imaged at 24 hpi as described above. (E) Quantification of TNF-α expression. Data are from 3 independent experiments. (F to H) Representative images of swimbladders. Median levels of TNF-α expression are shown for the vehicle control (F) and C. parapsilosis (G) and C. albicans (H) infections. (Left) Maximum projections of 15 to 18 z-slices; (right) dotted outline of swimbladder. All bars, 150 μm. Statistics are described in Materials and Methods (*, P ≤ 0.05; **, P ≤ 0.01; ***, P ≤ 0.001; ns, not significant [P > 0.05]).
|
