IMAGE

FIG 4

ID
ZDB-IMAGE-190723-166
Source
Figures for Archambault et al., 2019
Image
Figure Caption

FIG 4

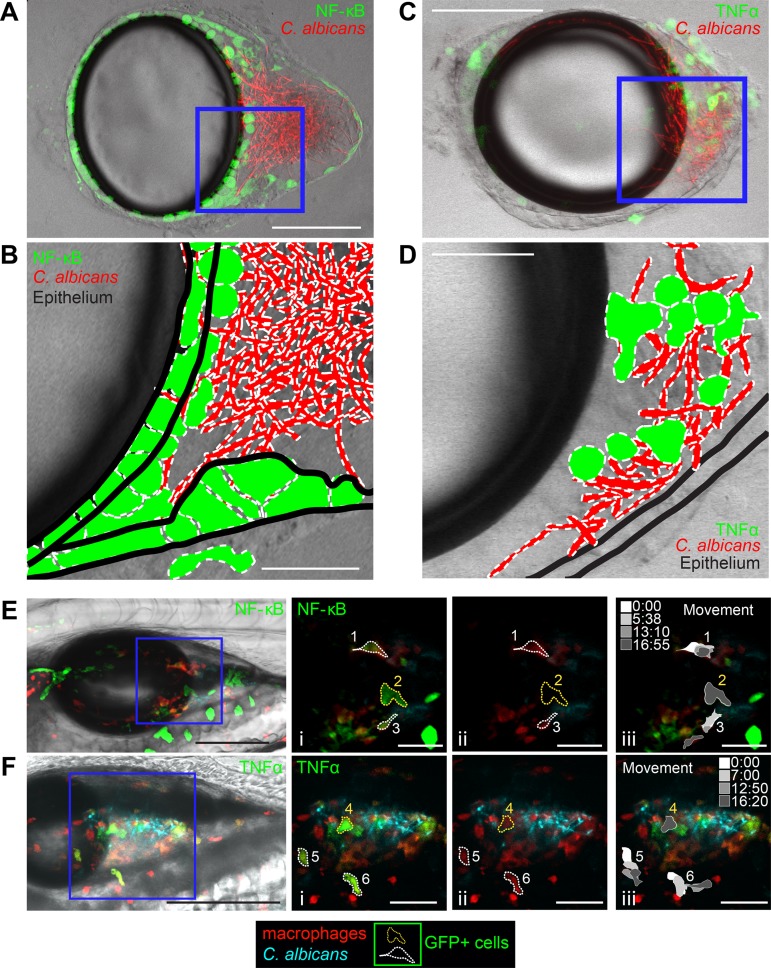
Patterns of NF-κB activation and TNF-α expression differ. Dissected swimbladders from C. albicans-infected fish were imaged at 24 hpi. (A) z-projection of 3 slices of a dissected Tg(NF-κB:EGFP) swimbladder with moderate EGFP expression. (B) Single z-slice from the blue square in the z-stack in panel A, with outlines of fungi, EGFP+ cells, and epithelial layers based on the DIC image. (C) z-projection of 7 slices of a TgBAC(tnfa:GFP) swimbladder with high GFP expression levels. (D) Single z-slice from the blue square in the z-stack in panel A, with outlines of fungi, GFP+ cells, and epithelial layers based on the DIC image. (E and F) Still images from time-lapse images taken at 24 hpi. (E) Tg(NF-κB:EGFP) × mpeg1:dTomato (red macrophage) zebrafish at time 0:00 of the time-lapse image in Movie S1 in the supplemental material. The leftmost image is a maximum-projection overlay of all colors using a middle plane from the DIC image. (i) Zoomed-in images of the areas outlined in the blue square. Dotted lines outline example cells that either moved (white outlines [cells 1 and 3]) or remained stationary (yellow outlines [cell 2]) over the 16-min-long time-lapse experiment. (ii) The GFP channel was eliminated to demonstrate red fluorescence of macrophages. Cells 1 and 3 are dTomato+ (macrophages), while cell 2 is not. (iii) Schematics showing the positions of each cell at the times indicated in the grayscale legend. Only cells 1 and 3 change shape or position. (F) TgBAC(tnfa:GFP) × mpeg1:dTomato zebrafish at time 0:00 of the time-lapse imaging in Movie S2. (i) Outlines of example cells (white, moved [cells 5 and 6]; yellow, stationary [cell 4]). (ii) Cells 4, 5, and 6 are dTomato+ (macrophages). (iii) Schematics showing movement over time. Cells 5 and 6 change shape and position over the course of the time-lapse experiment, but cell 4 does not. Color channels show z-projections of 13 slices (E) or 11 slices (F). DIC was performed for a single z-slice. Bars, 150 μm (A, C, E, and F) and 50 μm (B, D, Ei to Eiii, and Fi to Fiii).

Acknowledgments
This image is the copyrighted work of the attributed author or publisher, and ZFIN has permission only to display this image to its users. Additional permissions should be obtained from the applicable author or publisher of the image. Full text @ MBio