FIGURE SUMMARY
Title

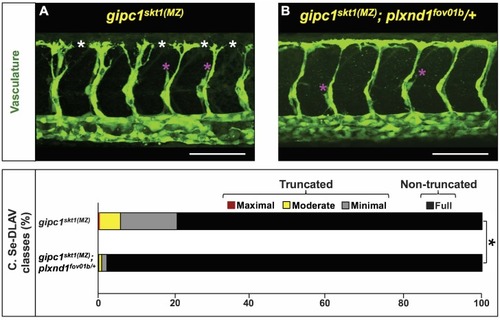
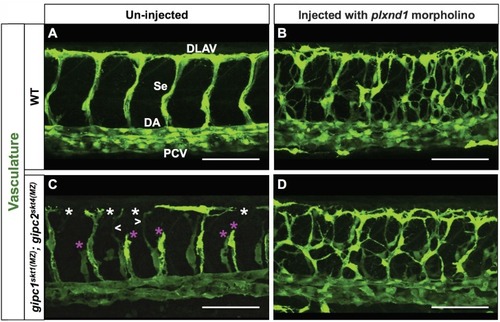
GIPC proteins negatively modulate Plexind1 signaling during vascular development

Authors
Carretero-Ortega, J., Chhangawala, Z., Hunt, S., Narvaez, C., Menéndez-González, J., Gay, C.M., Zygmunt, T., Li, X., Torres-Vázquez, J.
Source
Full text @ Elife

ZFIN is incorporating published figure images and captions as part of an ongoing project. Figures from some publications have not yet been curated, or are not available for display because of copyright restrictions.

ZFIN is incorporating published figure images and captions as part of an ongoing project. Figures from some publications have not yet been curated, or are not available for display because of copyright restrictions.

ZFIN is incorporating published figure images and captions as part of an ongoing project. Figures from some publications have not yet been curated, or are not available for display because of copyright restrictions.

ZFIN is incorporating published figure images and captions as part of an ongoing project. Figures from some publications have not yet been curated, or are not available for display because of copyright restrictions.

Penetrance and expressivity of Se-DLAV truncations in <italic>plxnd1<sup>skt6</sup></italic> mutants at 32 hpf.

(A) Penetrance bar graph. Percentage of embryos of the indicated genotypes with Se-DLAV truncations (gray; a summation of the ‘minimal,’ ‘moderate,’ and ‘maximal’ categories) and with non-truncated Se-DLAV (black; ‘full’ category). The distributions of these two phenotypic classes were not statistically significantly different between WT and plxnd1skt6 mutants as assessed by a two-sided Fisher Exact test, p=0.21739. (B) Expressivity bar graph. Percentage of ‘maximal’ (red), ‘moderate’ (yellow), and ‘minimal’ (gray) Se-DLAV truncations, and of ‘full’ (black) non-truncated Se-DLAV in plxnd1skt6 mutants with Se-DLAV truncations. For additional supplementary information related to this figure, see Supplementary file 3. This figure is related to Figure 2.

A Plxnd1 form deficient in GIPC binding because of deletion of the receptor’s GBM (Plxnd1Δ<sup>GBM</sup>) is active in vivo.

(A, B) Diagrams of the GAL4-responsive constructs used for forced endothelial expression in plxnd1fov01b; Tg(fli1a:GAL4FF)ubs4; Tg(flt1:nls-mCherry)skt7 embryos. (A) Construct for expression of the green fluorescent marker EGFP (negative control). (B) Construct for bicistronic coexpression of 2xHA-Plxnd1 (2xHA-Plxnd1WT or 2xHA-Plxnd1ΔGBM) and EGFP (to fluorescently label cells with exogenous 2xHA-Plxnd1 expression). (C–I) Confocal lateral images of 32 hpf embryo trunks. Anterior, left; dorsal, up. Scale bars (white horizontal lines), 50 μm. Image colors: Cells with exogenous gene expression, green (EGFP+); arterial nuclei, red; somite boundaries, blue. The position of EGFP+ clones within the arterial tree indicated as follows. DLAV (Dorsal Longitudinal Anastomotic Vessel), Se (Segmental vessel), DLAV-Se (both Se and DLAV), DAd (dorsal side of the Dorsal Aorta), and DAv (ventral side of the Dorsal Aorta). White asterisks mark clones with non-endothelial, ectopic expression. (C) Expression of EGFP alone fails to rescue the vascular defects of plxnD1fov01b mutants. EGFP+ arterial cells form mispatterned, ectopic and over branched Se vessels and aberrantly shaped DLAVs. (D–I) EGFP+ cells expressing 2xHA-Plxnd1WT (D–F) or 2xHA-Plxnd1ΔGBM (G–I) rescue the vascular defects of plxnd1fov01b mutants. These cells displayed a WT-like phenotype. Briefly, they were not found within ectopic Se sprouts, displayed normal shapes according to their position within Se and DLAVs and, when found at the base of a sprout, were properly positioned just anterior to a somite boundary; see (Zygmunt et al., 2011). (J) Bar graph. Quantification of the vascular phenotype (WT-like or plxnd1 null-like) of EGFP+ angiogenic endothelial cells (those at the DLAV, DLAV-Se, and DAd positions but not the DAV position) with exogenous expression of 2xHA-Plxnd1WT (top) or 2xHA-Plxnd1ΔGBM (bottom) in plxnd1fov01b mutants. Both 2xHA-Plxnd1 forms rescue the vascular defects of plxnd1fov01b mutants with similar efficiency. Quantifications. We scored the vascular phenotype of angiogenic endothelial cells in plxnd1fov01b mutants coexpressing EGFP and the following 2xHA-Plxnd1 forms: 2xHA-Plxnd1WT (21 clones, 15 embryos), 2xHA-Plxnd1ΔGBM (nine clones, 17 embryos). Note that embryos harboring only DAV clones were excluded from this analysis. The significance value (p=1) was calculated using a two-sided Fisher’s Exact test. The significant difference value is p<0.05. The proportions were not significantly different. For additional supplementary information related to this figure, see Supplementary file 1, Supplementary file 3 and Supplementary file 8. This figure is related to Figure 2.

Penetrance and expressivity of Se-DLAV truncations in DMSO-treated and SU5416-treated WT and embryos and <italic>plxnd1<sup>skt6</sup></italic> mutants at 32 hpf.

(A) Penetrance bar graph. Percentage of embryos of the indicated combinations of genotypes and treatments with Se-DLAV truncations (gray; a summation of the ‘minimal,’ ‘moderate,’ and ‘maximal’ categories) and with non-truncated Se-DLAV (black; ‘full’ category). Brackets and asterisks indicate pairs of genotypes with significantly different distributions of these two phenotypic classes as assessed by a two-sided Fisher Exact test, p<0.0083. (B) Expressivity bar graph. Percentage of ‘maximal’ (red), ‘moderate’ (yellow), and ‘minimal’ (gray) Se-DLAV truncations and of ‘full’ (black) non-truncated Se-DLAV in embryos with Se-DLAV truncations of the indicated combinations of genotypes and treatments. Brackets and asterisks indicate pairs of genotypes with significantly different distributions of the four phenotypic classes as assessed by a two-sided Fisher Exact test, p<0.0083. For additional supplementary information related to this figure, see Supplementary file 4. This figure is related to Figure 3.

GIPC proteins encoded by both the wild-type and mutant <italic>gipc1, gipc2</italic>, and <italic>gipc3</italic> alleles.

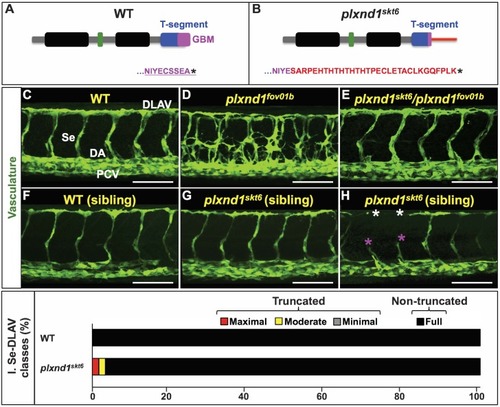
In the mutant proteins, the red bar denotes novel amino acid sequences resulting from mutagenic frameshift(s). See Supplementary file 1 and Supplementary file 8. Related to Figure 4.

Angiogenesis deficits of <italic>gipc1<sup>skt1</sup></italic> and <italic>gipc2 <sup>skt3/skt4</sup></italic> mutants at 32 hpf.

(A–C) Confocal lateral images of the trunk vasculature (green) of 32 hpf embryos (region dorsal to the yolk extension). Anterior, left; dorsal, up. Scale bars (white horizontal lines), 100 μm. Genotypes indicated on top of each image in yellow font. Angiogenesis deficits are indicated as follows: white asterisks (DLAV gaps), magenta asterisks (truncated Se), white greater/less-than signs (thin Se). In the WT image (A), the vessels are designated with the white font as follows: DLAV (Dorsal Longitudinal Anastomotic Vessel), Se (Segmental Vessel), DA (Dorsal Aorta), and PCV (Posterior Cardinal Vein). Related to Figure 4.

Penetrance and expressivity of Se-DLAV truncations in <italic>gipc1<sup>skt1(MZ)</sup></italic> and <italic>gipc1<sup>skt1(MZ)</sup>; plxnd1<sup>fov01b</sup>/+</italic> embryos at 32 hpf.

(A) Penetrance bar graph. Percentage of embryos of the indicated genotypes with Se-DLAV truncations (gray; a summation of the ‘minimal,’ ‘moderate,’ and ‘maximal’ categories) and with non-truncated Se-DLAV (black; ‘full’ category). The distributions of these two phenotypic classes were statistically significantly different between gipc1skt1(MZ) and gipc1skt1(MZ); plxnd1fov01b/+ embryos as assessed by a two-sided Fisher Exact test, p=0.0361. (B) Expressivity bar graph. Percentage of ‘maximal’ (red), ‘moderate’ (yellow), and ‘minimal’ (gray) Se-DLAV truncations and of ‘full’ (black) non-truncated Se-DLAV in embryos with Se-DLAV truncations of the indicated genotypes. The distributions of these four phenotypic classes were statistically significantly different between gipc1skt1(MZ) and gipc1skt1(MZ); plxnd1fov01b/+ embryos (brackets and asterisks) as assessed by a two-sided Fisher Exact test, p=0.00004. For additional supplementary information related to this figure, see Supplementary file 6. This figure is related to Figure 5.

Removal of <italic>plxnd1</italic> activity from <italic>gipc1<sup>skt1(MZ)</sup>; gipc2<sup>skt4(MZ)</sup></italic> maternal-zygotic (MZ) double mutants yields a phenotype similar to that of <italic>plxnd1</italic> nulls.

(A–D) Confocal lateral images of the trunk vasculature (green) of 32 hpf embryos (region dorsal to the yolk extension). Anterior, left; dorsal, up. Scale bars (white horizontal lines), 100 μm. Morpholino injection (un-injected or injected with plxnd1 morpholino) indicated on top, genotypes (WT or gipc1skt1(MZ); gipc2skt4(MZ)) indicated on the left. The un-injected WT picture (A) shows the names of the major vessels in white font: DLAV (Dorsal Longitudinal Anastomotic Vessel), Se (Segmental Vessel), DA (Dorsal Aorta), and PCV (Posterior Cardinal Vein). Vascular defects highlighted as follows: truncated or missing Se (magenta asterisk), thin Se (white greater/less-than signs), DLAV gaps (white asterisk). Quantifications. The following number of embryos were analyzed: WT (four embryos), WT injected with plxnd1 morpholino (four embryos; 4/4 showed a vascular phenotype similar to that of plxnd1fov01b nulls), gipc1skt1(MZ); gipc2skt4(MZ) (12 embryos; 7/12 showed angiogenesis deficits), and gipc1skt1(MZ); gipc2skt4(MZ) injected with plxnd1 morpholino (11 embryos; 11/11 showed a vascular phenotype similar to that of plxnd1fov01b nulls).

Acknowledgments
This image is the copyrighted work of the attributed author or publisher, and ZFIN has permission only to display this image to its users. Additional permissions should be obtained from the applicable author or publisher of the image. Full text @ Elife