
- Title
-
The selective autophagy receptors Optineurin and p62 are both required for zebrafish host resistance to mycobacterial infection
- Authors
- Zhang, R., Varela, M., Vallentgoed, W., Forn-Cuni, G., van der Vaart, M., Meijer, A.H.
- Source
- Full text @ PLoS Pathog.

Ubiquitination and autophagy activity can be induced by Mm infection. (A) Schematic diagram of the zebrafish Mm infection model for early stages of Tb. Fluorescently labelled Mm bacteria are microinjected into the blood island of embryos at 28 hpf. Red dots represent small clusters of Mm-infected cells visible from 1 dpi. At 3 dpi these Mm clusters have grown into early stage granulomas. (B) Representative confocal micrographs of GFP-Lc3 co-localization with mCherry-labeled Mm clusters in infected embryos/larvae at 1, 2 and 3 dpi. Scale bars, 10 μm. (C) Quantification of the percentage of Mm clusters positive for GFP-Lc3 at 1 and 2 dpi. The results were accumulated from two individual experiments (≥ 20 embryos/group). ns, non-significant, *p<0.05, **p<0.01, ***p<0.001. (D) Representative confocal micrographs of GFP-Lc3 co-localization with mCrimson-labeled Mm clusters in an mpeg1:mCherry-expressing macrophage at 3 dpi. Arrowheads indicate intra-macrophage GFP-Lc3-positive Mm. Scale bars, 10 μm. (E) Western blot determination of Lc3 protein levels in Mm-infected embryos/larvae and uninfected controls. Protein samples were extracted at 1, 2 and 3 dpi (>10 larvae/sample). The Western blot was probed with antibodies against Lc3 and Actin as a loading control and is representative for three independent experimental repeats. The Lc3-II/Lc3-I ratio is indicated below. (F) Representative confocal micrographs of Ubiquitin antibody co-localization with Mm clusters in infected embryos/larvae at 1, 2 and 3 dpi. Scale bars, 10 μm. (G) Quantification of the percentage of Mm clusters positive for ubiquitin staining at 1 and 2 dpi (≥ 15 embryo/group). The results are accumulated from two independent experiments. ns, non-significant, *p<0.05, **p<0.01, ***p<0.001. (H) Western blot analysis of ubiquitination levels in Mm-infected embryos/larvae and uninfected controls. Protein samples were extracted at 1, 2 and 3 dpi (>10 larvae/sample). The Western blot was probed with an antibody detecting both poly- and mono-ubiquitin and with anti-Actin antibody as a loading control and is representative for three independent experimental repeats. (I) Representative confocal micrographs of GFP-Lc3 and Ubiquitin co-localization with Mm clusters in infected larvae at 3 dpi. Scale bars, 10 μm.
|
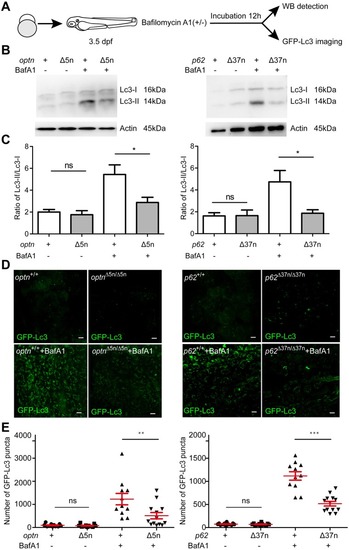
Optn or p62 deficiency affects autophagosome formation. (A) Workflow of the experiments shown in (B-G). Larvae were treated with 100 nM of Baf A1 for 12 h from 3.5 dpf. The GPF-Lc3 negative larvae were selected to assay autophagy activity by Western blot, the GFP-Lc3 positive larvae were collected to monitor autophagic activity using confocal imaging. The red square indicates the region for confocal imaging. (B) Level of basal autophagy in WT and mutant embryos in absence or presence of Baf A1. Protein samples were extracted from 4 dpf WT and mutant larvae (>10 embryos/sample). The blots were probed with antibodies against Lc3 and Actin as a loading control. Western blots were repeated at least three times with independent extracts. (C) Quantification of Lc3-II fold changes in WT and mutant embryos in absence or presence of Baf A1. Western blot band intensities were quantified by Lab Image. Data is combined from three independent experiments. (D) Representative confocal micrographs of GFP-Lc3 puncta present in the tail fin of optn+/+, optnΔ5n/Δ5n, p62+/+ and p62Δ37n/Δ37n at 4 dpf. Scale bars, 10 μm. (E). Quantification of the number of GFP-Lc3 puncta in optn+/+, optnΔ5n/Δ5n, p62+/+ and p62Δ37n/Δ37n larvae with and without Baf A1 treatment. Each larva was imaged at a pre-defined region of the tail fin (as indicated by the red boxed area in Fig3 A) (≥11 larvae/group). Results are accumulated from two independent experiments. ns, non-significant, *p<0.05, **p<0.01, ***p<0.001. |
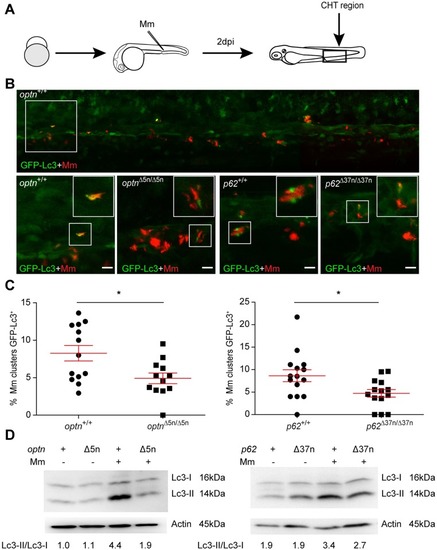
Optn or p62 deficiency inhibits targeting of Mm by GFP-Lc3. (A) Workflow of the experiment shown in B. 2 dpi fixed larvae were used for confocal imaging. The entire CHT region was imaged, as indicated by the black box. (B) Representative confocal micrographs of GFP-Lc3 co-localization with Mm clusters in infected larvae. The top image shows an overview of the CHT region in optn+/+ infected larvae. The area indicated by the white box is detailed below. The bottom images show GFP-Lc3 co-localization of Mm clusters in optn+/+, optnΔ5n/Δ5n, p62+/+ and p62Δ37n/Δ37n infected larvae. The arrowheads indicate the overlap between GFP-Lc3 and Mm clusters. Scale bars, 10 μm. (C) Quantification of the percentage of Mm clusters positive for GFP-Lc3 vesicles. The data is accumulated from two independent experiments; each dot represents an individual larva (≥12 larvae/group). ns, non-significant, *p<0.05, **p<0.01, ***p<0.001. (D) Western blot analysis of Lc3 protein levels in infected and uninfected larvae. Protein samples were extracted from 4 dpf larvae (>10 larvae/sample). The blots were probed with antibodies against Lc3 and Actin as a loading control and Lc3-II/Lc3-I ratios are indicated below. Western blots were repeated twice with independent extracts. |
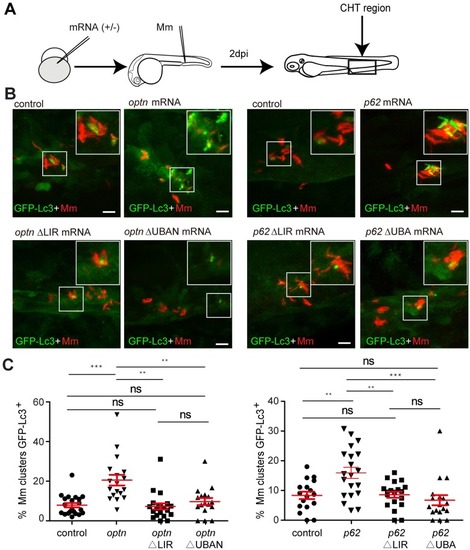
Transient overexpression of optn or p62 mRNA promotes GFP-Lc3 recruitment to Mm clusters. (A) Workflow of the experiments in (B-C). optn or p62 mRNA was injected into the one cell stage of embryos and 2 dpi fixed larvae were used for confocal imaging. The entire CHT region was imaged, as indicated by the black box. (B) Representative confocal micrographs of GFP-Lc3 co-localization with Mm clusters in larvae injected with full length or ΔLIR/ΔUBA(N) deletion mRNAs of optn and p62. The arrowheads indicate the overlap between GFP-Lc3 and Mm clusters. Scale bars, 10 μm. (C) Quantification of the percentage of Mm clusters positive for GFP-Lc3 vesicles. Each dot represents an individual larva (≥18 larvae/group). Data are accumulated from two independent experiments. ns, non-significant, *p<0.05, **P<0.01, *** p<0.001. |

ZFIN is incorporating published figure images and captions as part of an ongoing project. Figures from some publications have not yet been curated, or are not available for display because of copyright restrictions. EXPRESSION / LABELING:
PHENOTYPE:
|
|
ZFIN is incorporating published figure images and captions as part of an ongoing project. Figures from some publications have not yet been curated, or are not available for display because of copyright restrictions. PHENOTYPE:
|