
Fig 3
- ID
- ZDB-IMAGE-190723-1365
- Genes
- Antibodies
- Publication
- Zhang et al., 2019 - The selective autophagy receptors Optineurin and p62 are both required for zebrafish host resistance to mycobacterial infection
- All Figures
- Figures for Zhang et al., 2019
|
Fig 3
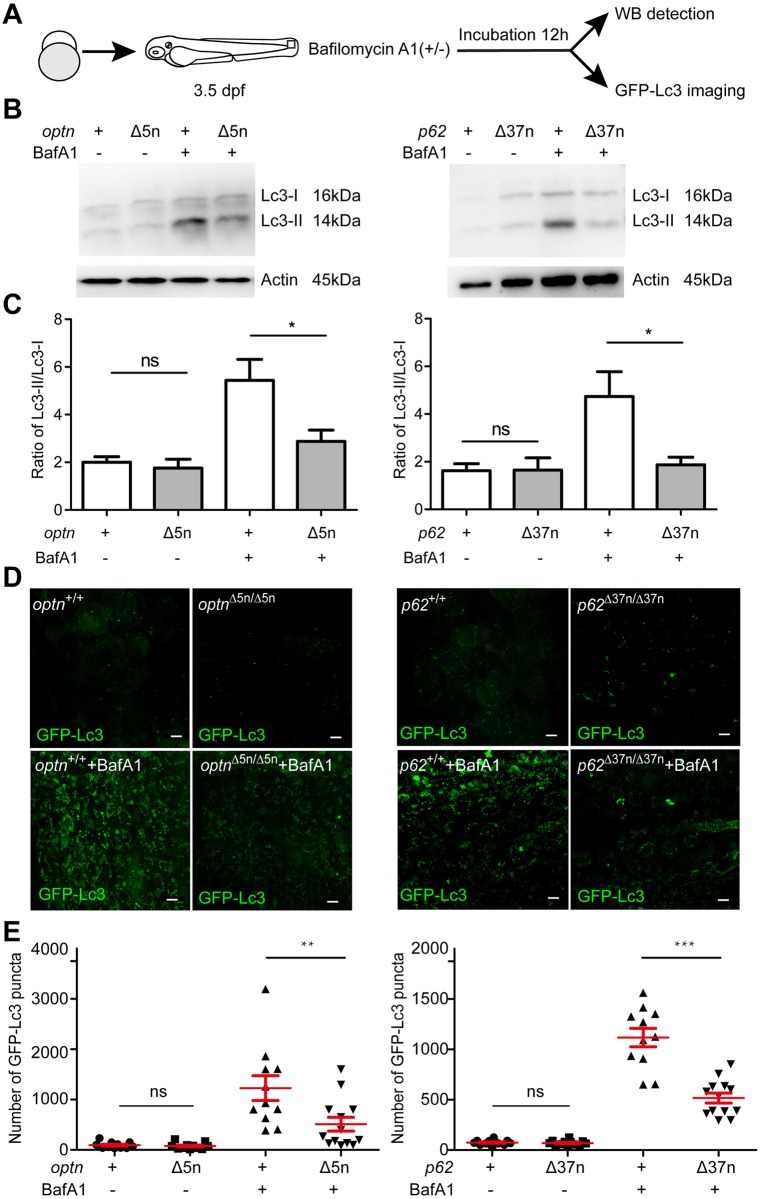
(A) Workflow of the experiments shown in (B-G). Larvae were treated with 100 nM of Baf A1 for 12 h from 3.5 dpf. The GPF-Lc3 negative larvae were selected to assay autophagy activity by Western blot, the GFP-Lc3 positive larvae were collected to monitor autophagic activity using confocal imaging. The red square indicates the region for confocal imaging. (B) Level of basal autophagy in WT and mutant embryos in absence or presence of Baf A1. Protein samples were extracted from 4 dpf WT and mutant larvae (>10 embryos/sample). The blots were probed with antibodies against Lc3 and Actin as a loading control. Western blots were repeated at least three times with independent extracts. (C) Quantification of Lc3-II fold changes in WT and mutant embryos in absence or presence of Baf A1. Western blot band intensities were quantified by Lab Image. Data is combined from three independent experiments. (D) Representative confocal micrographs of GFP-Lc3 puncta present in the tail fin of optn+/+, optnΔ5n/Δ5n, p62+/+ and p62Δ37n/Δ37n at 4 dpf. Scale bars, 10 μm. (E). Quantification of the number of GFP-Lc3 puncta in optn+/+, optnΔ5n/Δ5n, p62+/+ and p62Δ37n/Δ37n larvae with and without Baf A1 treatment. Each larva was imaged at a pre-defined region of the tail fin (as indicated by the red boxed area in Fig3 A) (≥11 larvae/group). Results are accumulated from two independent experiments. ns, non-significant, *p<0.05, **p<0.01, ***p<0.001.