
- Title
-
Exposure to Antibiotics Affects Saponin Immersion-Induced Immune Stimulation and Shift in Microbial Composition in Zebrafish Larvae
- Authors
- L¾pez Nadal, A., Peggs, D., Wiegertjes, G.F., Brugman, S.
- Source
- Full text @ Front Microbiol
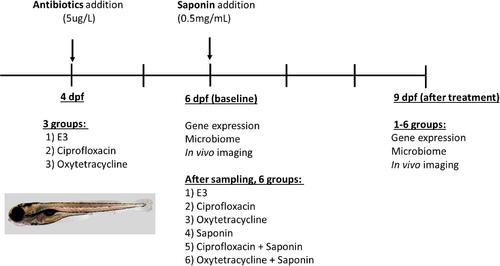
Experimental design and sampling strategy for the antibiotics/saponin experiment. |
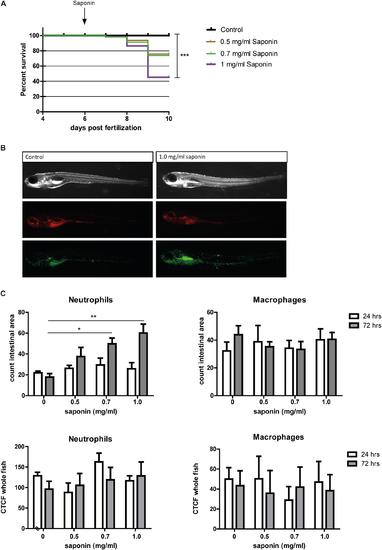
Effect of saponin immersion on zebrafish larvae. (A) Percent survival of zebrafish exposed to control (E3), 0.5 mg/ml saponin, 0.7 mg/ml saponin and 1 mg/ml saponin from 6 - 9 dpf (n = 40 fish / treatment) (Log-rank Mantel-Cox Test for Chi-square, ???p < 0.0005). (B) Representative pictures of the saponin-treated Tg(mpeg1:mCherry-Fump2/mpx:eGFPi114) fish displaying green neutrophils and red macrophages. (C) Quantification of neutrophils and macrophages in the intestinal area (n = 6?11 fish / group) (one way ANOVA Kruskal-Wallis test with Dunn?s Multiple comparison Post-Test, mean ▒ SEM, ?p < 0.05 ??p < 0.01). Top: counted cells in intestinal area. Bottom: Corrected Total Cell Fluorescence (CTCF, measure for total fluorescent pixels in the whole fish). Two independent experiments were performed and data are combined. |
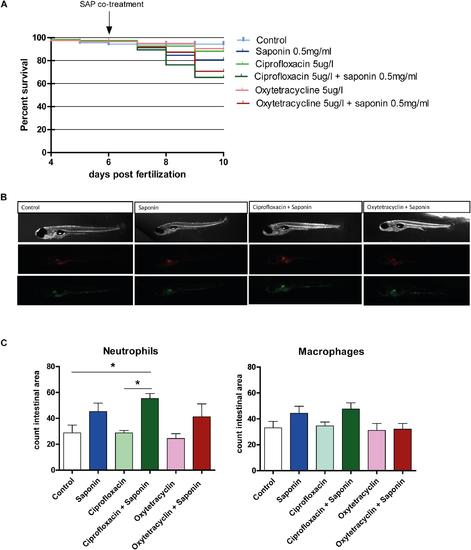
Effect of antibiotic exposure on saponin-immune-stimulation. (A) Percent survival of zebrafish exposed to control (E3), ciprofloxacin (4?9 dpf) (5 ug/L) or oxytetracycline (4?9 dpf) (5 ug/ml) + /- saponin (0.5 mg/ml) from 6 ? 9 dpf (n = 100 fish / treatment) (Log-rank Mantel-Cox Test for Chi-square). (B) Representative pictures of the antibiotic/saponin-treated Tg(mpeg1:mCherry-Fump2/mpx:eGFPi114) fish displaying green neutrophils and red macrophages. (C) Quantification of neutrophils and macrophages in the intestinal area (n = 10 fish/ group) (one way ANOVA Kruskal-Wallis test with Dunn?s Multiple comparison Post-Test, mean ▒ SEM, ?p < 0.05). Two independent experiments were performed and one representative experiment is shown. |
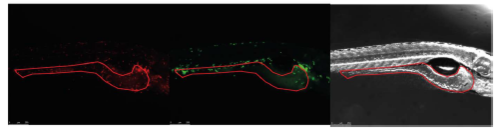
Representative picture of the intestine region selected in the bright field and copied to the green and red channel pictures for neutrophil and macrophage count. |
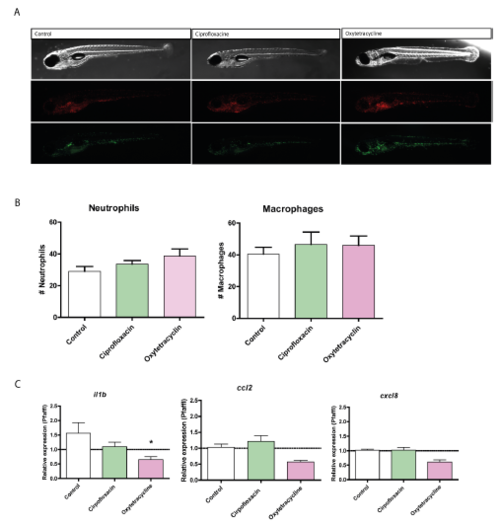
Representative pictures of neutrophil and macrophage imaging at baseline (6 dpf) for control (E3), Ciprofloxacin and Oxytetracycline treated larvae (exposure from 4?6 dpf), (B) Quantification of neutrophil and macrophage number in the intestinal area (n = 10 larvae/treatment). (C) Relative gene expression on pools of whole zebrafish larvae (n = 4 pools of 5 larvae/ treatment) for the following cytokines: il-1?, ccl2, cxcl8, (one way ANOVA Kruskal-Wallis test with Dunn?s Multiple comparison Post-Test, mean ▒ SEM. |