
Image
|
Figure Caption
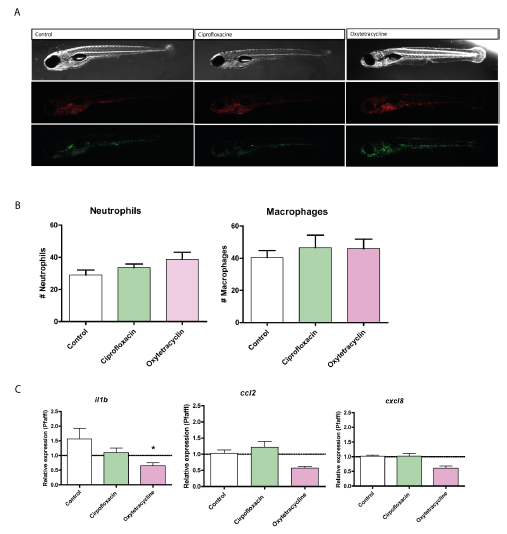
Fig. S3
Representative pictures of neutrophil and macrophage imaging at baseline (6 dpf) for control (E3), Ciprofloxacin and Oxytetracycline treated larvae (exposure from 4–6 dpf), (B) Quantification of neutrophil and macrophage number in the intestinal area (n = 10 larvae/treatment). (C) Relative gene expression on pools of whole zebrafish larvae (n = 4 pools of 5 larvae/ treatment) for the following cytokines: il-1β, ccl2, cxcl8, (one way ANOVA Kruskal-Wallis test with Dunn’s Multiple comparison Post-Test, mean ± SEM.
Acknowledgments
This image is the copyrighted work of the attributed author or publisher, and
ZFIN has permission only to display this image to its users.
Additional permissions should be obtained from the applicable author or publisher of the image.
Full text @ Front Microbiol