
|
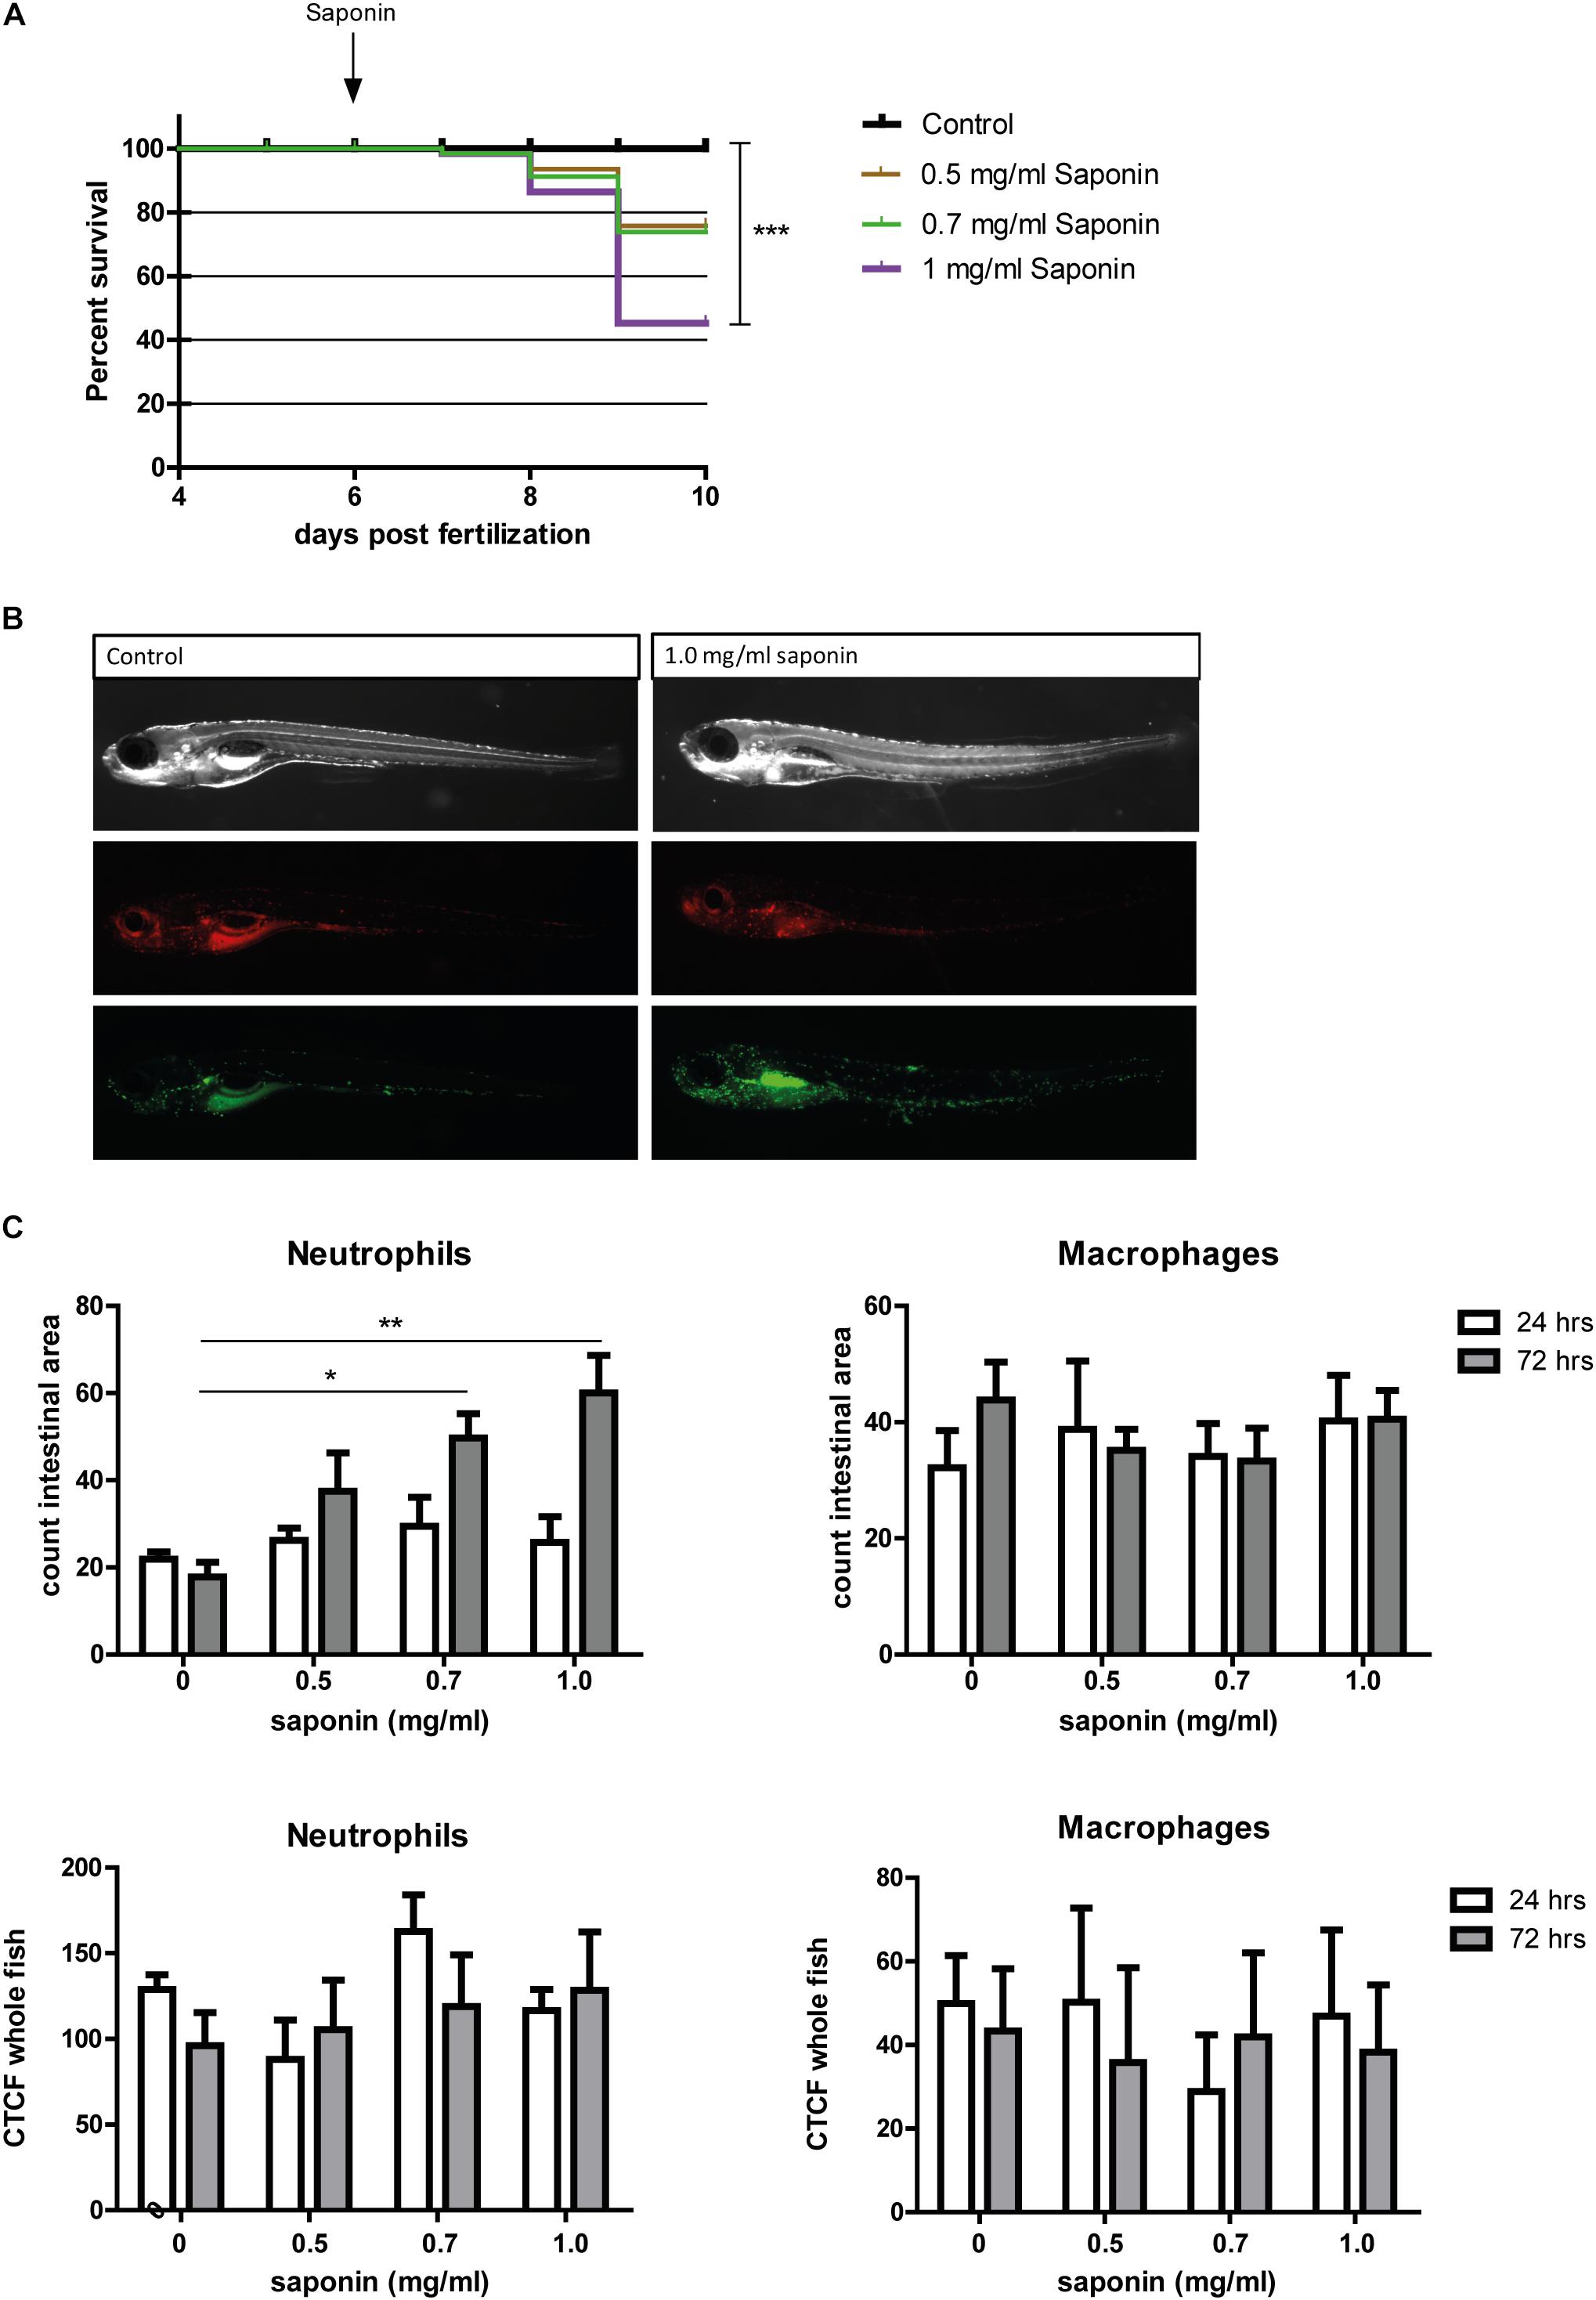
Fig. 2
Effect of saponin immersion on zebrafish larvae. (A) Percent survival of zebrafish exposed to control (E3), 0.5 mg/ml saponin, 0.7 mg/ml saponin and 1 mg/ml saponin from 6 - 9 dpf (n = 40 fish / treatment) (Log-rank Mantel-Cox Test for Chi-square, ∗∗∗p < 0.0005). (B) Representative pictures of the saponin-treated Tg(mpeg1:mCherry-Fump2/mpx:eGFPi114) fish displaying green neutrophils and red macrophages. (C) Quantification of neutrophils and macrophages in the intestinal area (n = 6–11 fish / group) (one way ANOVA Kruskal-Wallis test with Dunn’s Multiple comparison Post-Test, mean ± SEM, ∗p < 0.05 ∗∗p < 0.01). Top: counted cells in intestinal area. Bottom: Corrected Total Cell Fluorescence (CTCF, measure for total fluorescent pixels in the whole fish). Two independent experiments were performed and data are combined.