
- Title
-
Single-cell analyses identify distinct and intermediate states of zebrafish pancreatic islet development
- Authors
- Lu, C.J., Fan, X.Y., Guo, Y.F., Cheng, Z.C., Dong, J., Chen, J.Z., Li, L.Y., Wang, M.W., Wu, Z.K., Wang, F., Tong, X.J., Luo, L.F., Tang, F.C., Zhu, Z.Y., Zhang, B.
- Source
- Full text @ J. Mol. Cell Biol.
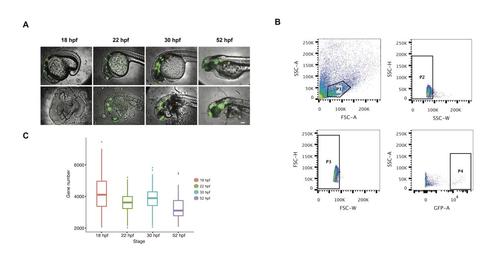
Sample preparation and data processing. A) TgBAC(Neurod1:EGFP) embryos before (upper panel) and after (lower panel) dissection at different developmental stages. The red arrowheads indicate the dissected endocrine islet. The bar represents 100 μm. B) FACS sorting process of the dissected endocrine pancreas from 30 hpf zebrafish embryos (Sample sorting from other stages followed the same strategy). Cellular debris was removed by P1 gating, followed by P2 and P3 gating to collect single cells. Finally, GFP-positive cells were sorted by P4 gating. C) Boxplot results of detected genes (TPM > 0) in each cell. Related to Figure 1 and Table S1. |
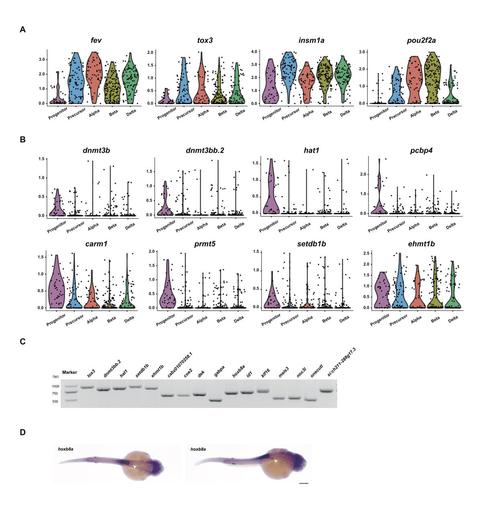
Newly identified endocrine markers and enriched epigenetic factors in progenitors. A) Violin plot of newly identified endocrine markers fev, tox3, insm1a, and pou2f2a. B) Violin plot showing expression patterns of progenitor cell enriched epigenetic factors dnmt3b, dnmt3bb.2, hat1, pcbp4, carm1, prmt5, setdb1b and ehmt1b. C) RT-PCR analysis of the expression of progenitor cell enriched transcription factors in pooled single-cell RNA-seq libraries from stages of 18 hpf, 22 hpf and 30 hpf zebrafiah embryos. D) mRNA expression of hoxb8a in a 30 hpf zebrafiah embryo revealed by whole mount in situ hybridization. The arrowheads indicate the pancreas region, and the bar represents 200 μM. Related to Figure 2 and Table S2. |
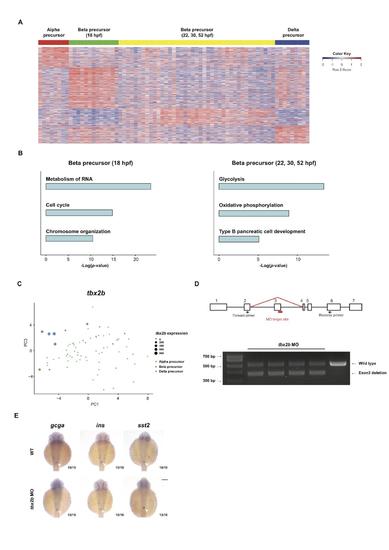
Comparison of separate lineage primed precursors. A) Heat map of differentially expressed genes in alpha precursors (red), beta Lu et al. - Single-cell analyses identify distinct and intermediate states of zebrafish pancreatic islet development
precursors at 18 hpf (green), beta precursors at 22, 30 and 52 hpf (yellow), and delta precursors (blue). B) GO terms of beta precursors at 18 hpf (left) and beta precursors at 22, 30 and 52 hpf (right) in comparison with the other precursor cells. C) PCA plot showing the expression of tbx2b across alpha, beta and delta precursors. D) The target design and evaluation of knowndown efficiency of the tbx2b morpholino by RT-PCR. E) Expression of alpha, beta and delta cell hormone markers gcga, ins and sst2 in 30 hpf tbx2b morphants detected by whole mount in situ hybridization. The arrowheads indicate the pancreas region, and the bar represents 200 μM. Related to Figure 3 and Table S3. |