
Fig. S1
- ID
- ZDB-IMAGE-190925-4
- Publication
- Lu et al., 2018 - Single-cell analyses identify distinct and intermediate states of zebrafish pancreatic islet development
- All Figures
- Figures for Lu et al., 2018
|
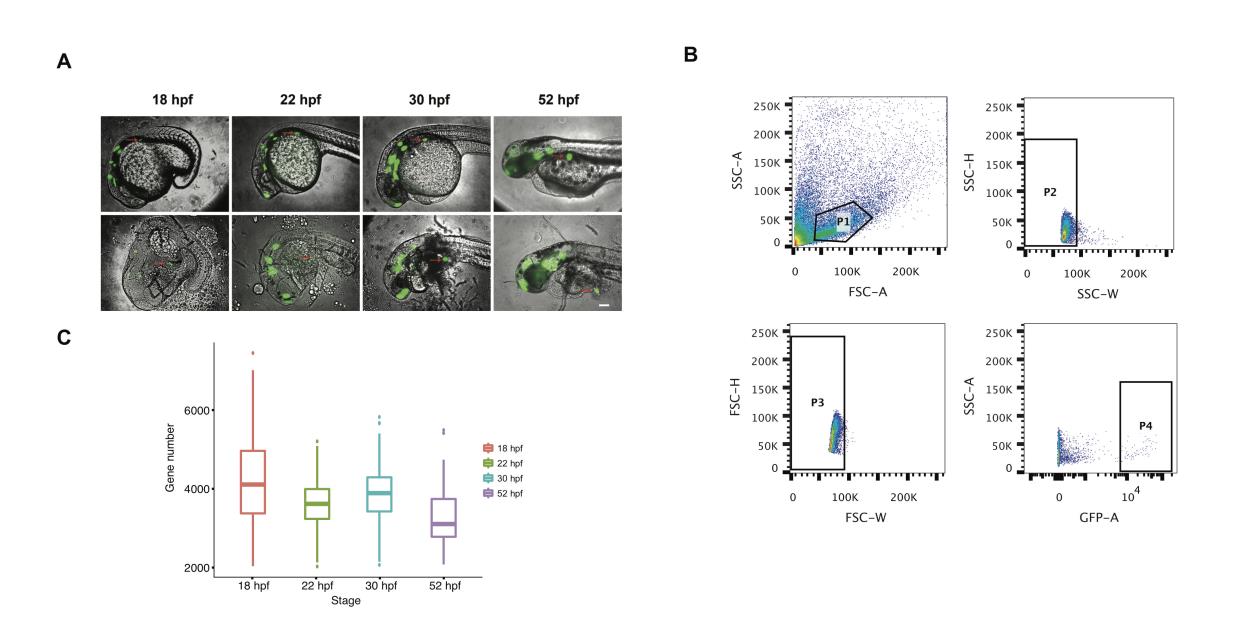
Fig. S1
Sample preparation and data processing. A) TgBAC(Neurod1:EGFP) embryos before (upper panel) and after (lower panel) dissection at different developmental stages. The red arrowheads indicate the dissected endocrine islet. The bar represents 100 μm. B) FACS sorting process of the dissected endocrine pancreas from 30 hpf zebrafish embryos (Sample sorting from other stages followed the same strategy). Cellular debris was removed by P1 gating, followed by P2 and P3 gating to collect single cells. Finally, GFP-positive cells were sorted by P4 gating. C) Boxplot results of detected genes (TPM > 0) in each cell. Related to Figure 1 and Table S1.