
Fig. S3
- ID
- ZDB-IMAGE-190925-6
- Publication
- Lu et al., 2018 - Single-cell analyses identify distinct and intermediate states of zebrafish pancreatic islet development
- All Figures
- Figures for Lu et al., 2018
|
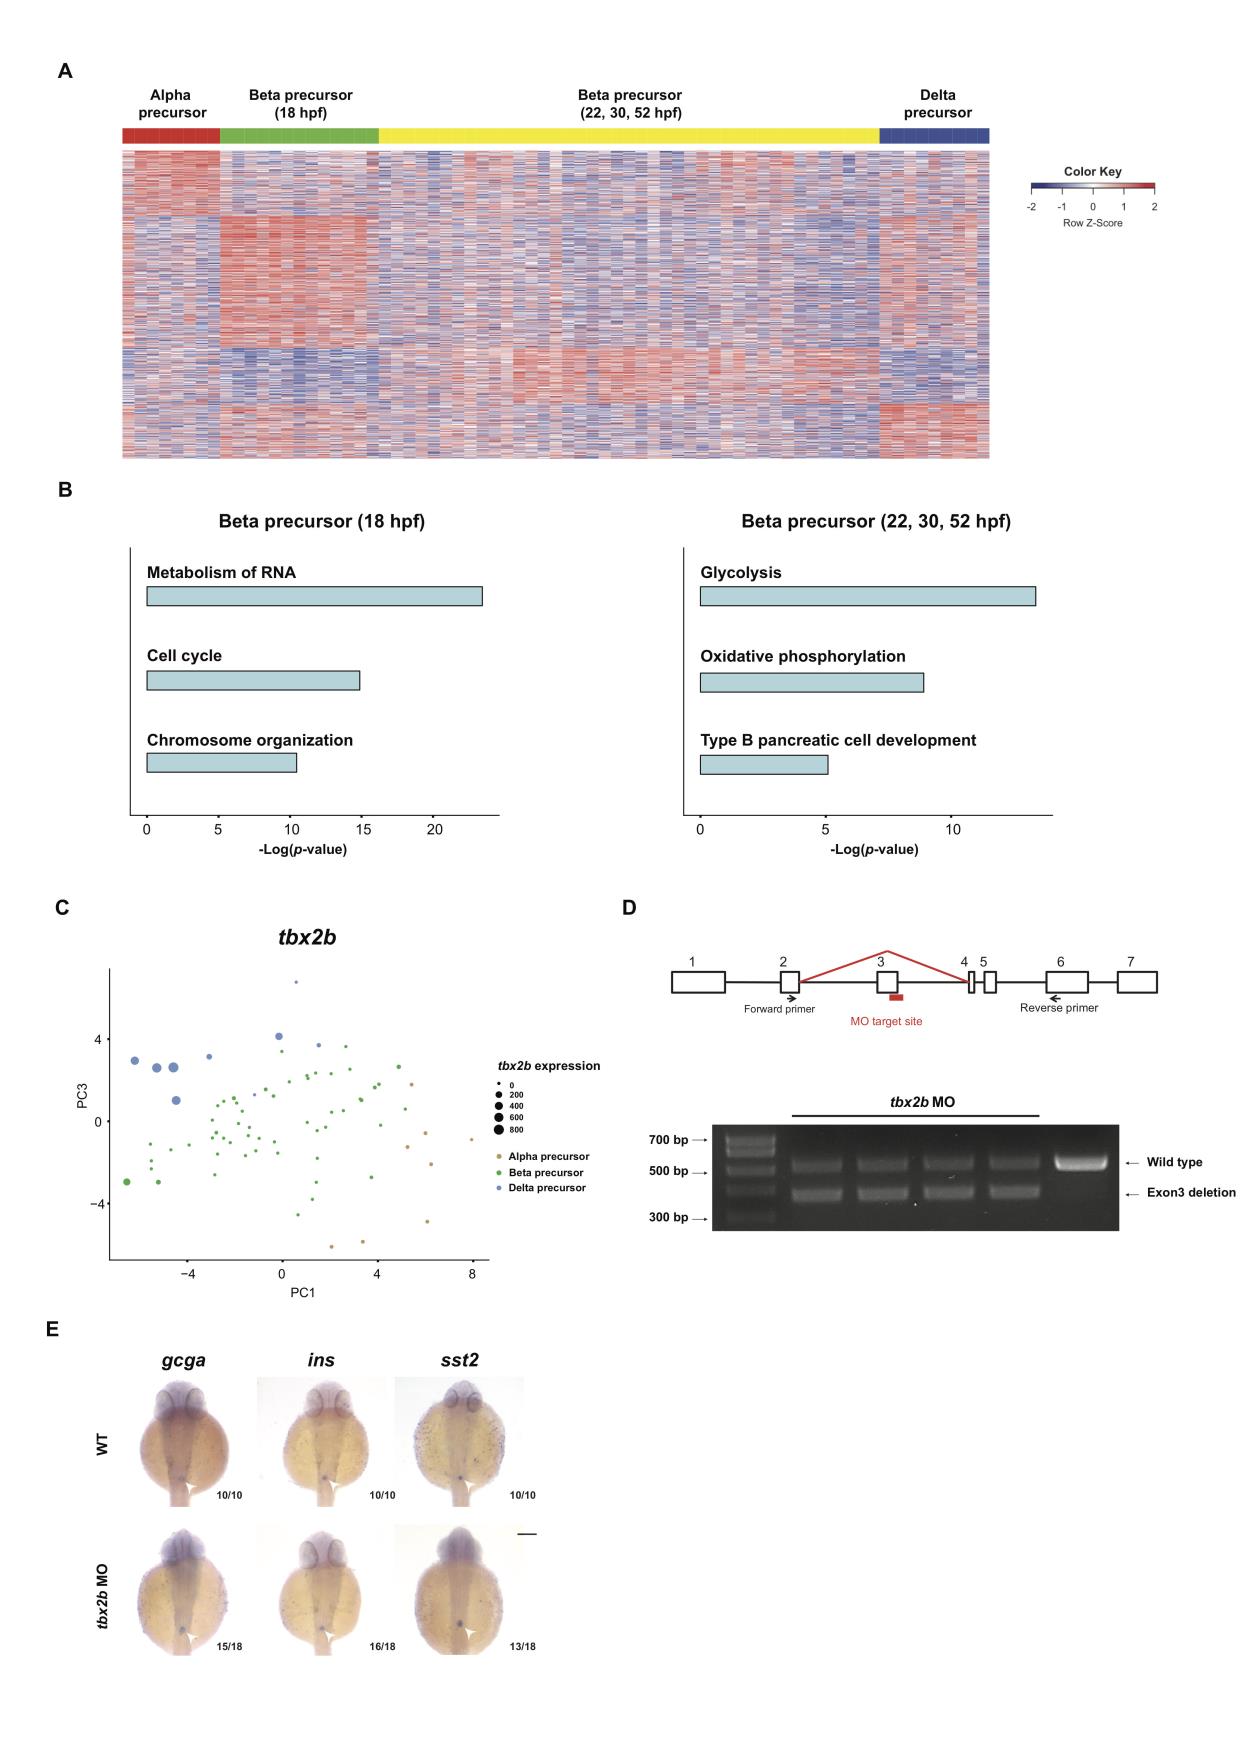
Fig. S3
Comparison of separate lineage primed precursors. A) Heat map of differentially expressed genes in alpha precursors (red), beta Lu et al. - Single-cell analyses identify distinct and intermediate states of zebrafish pancreatic islet development
precursors at 18 hpf (green), beta precursors at 22, 30 and 52 hpf (yellow), and delta precursors (blue). B) GO terms of beta precursors at 18 hpf (left) and beta precursors at 22, 30 and 52 hpf (right) in comparison with the other precursor cells. C) PCA plot showing the expression of tbx2b across alpha, beta and delta precursors. D) The target design and evaluation of knowndown efficiency of the tbx2b morpholino by RT-PCR. E) Expression of alpha, beta and delta cell hormone markers gcga, ins and sst2 in 30 hpf tbx2b morphants detected by whole mount in situ hybridization. The arrowheads indicate the pancreas region, and the bar represents 200 μM. Related to Figure 3 and Table S3.