
Fig. S2
- ID
- ZDB-FIG-190925-7
- Publication
- Lu et al., 2018 - Single-cell analyses identify distinct and intermediate states of zebrafish pancreatic islet development
- Other Figures
- All Figure Page
- Back to All Figure Page
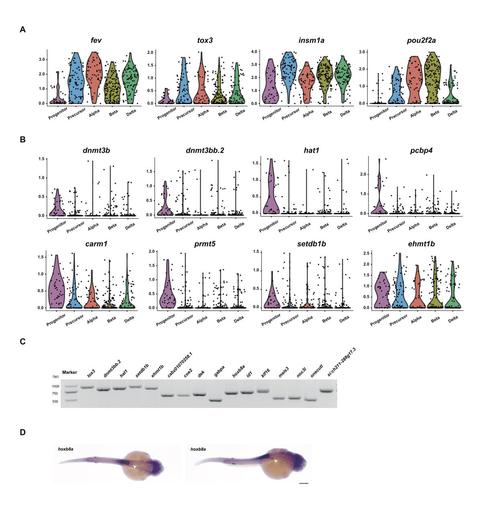
Newly identified endocrine markers and enriched epigenetic factors in progenitors. A) Violin plot of newly identified endocrine markers fev, tox3, insm1a, and pou2f2a. B) Violin plot showing expression patterns of progenitor cell enriched epigenetic factors dnmt3b, dnmt3bb.2, hat1, pcbp4, carm1, prmt5, setdb1b and ehmt1b. C) RT-PCR analysis of the expression of progenitor cell enriched transcription factors in pooled single-cell RNA-seq libraries from stages of 18 hpf, 22 hpf and 30 hpf zebrafiah embryos. D) mRNA expression of hoxb8a in a 30 hpf zebrafiah embryo revealed by whole mount in situ hybridization. The arrowheads indicate the pancreas region, and the bar represents 200 μM. Related to Figure 2 and Table S2. |