
- Title
-
An in vivo translation-reporter system for the study of protein synthesis in zebrafish embryos
- Authors
- Palha, I.G., Anselme, I., Schneider-Maunoury, S., Giudicelli, F.
- Source
- Full text @ Biol. Open
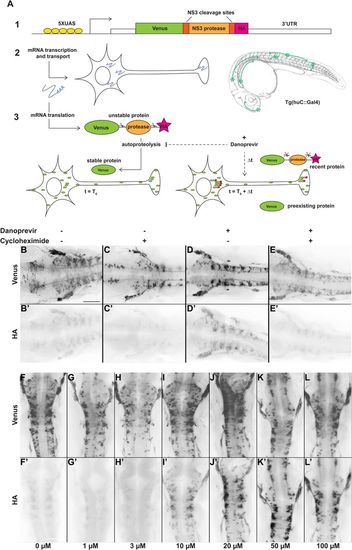
Protease-controlled translation reporter system. (A) Principle of the SPoT method. (1) The translation reporter cassette encodes a myristoylated form of the Yellow Fluorescent Protein Venus fused to NS3 protease domain, flanked by two of its own specific cleavage sites, and a HA epitope tag. (2) The UAS-controlled promoter ensures expression of the construct in neurons in Tg(huC:Gal4) transgenic line. (3) In normal conditions, the protease cleaves itself rapidly after translation, removing the HA peptide. At time T0, addition of a small cell-permeable molecule (Danoprevir) prevents protease activity and stabilizes subsequently synthesized proteins, maintaining their HA tag. HA-labeled proteins, that have been synthesized during the Δt period between T0 and fixation, reveal sites of translation. (B–E′) Flatmounted immunostaining for Venus (top row) and HA (bottom row) of Tg(SPoT_chicken ß-actin) embryos incubated for 1 h with Danoprevir (D,D′), Cycloheximide (C,C′), both (E,E′) or none (B,B′). (F–L′) Flatmounted immunostaining for Venus (top row) and HA (bottom row) of Tg(SPoT_chicken ß-actin) embryos incubated for 1.5 h with increasing concentrations of Danoprevir. Scale bars: 200 µm. |
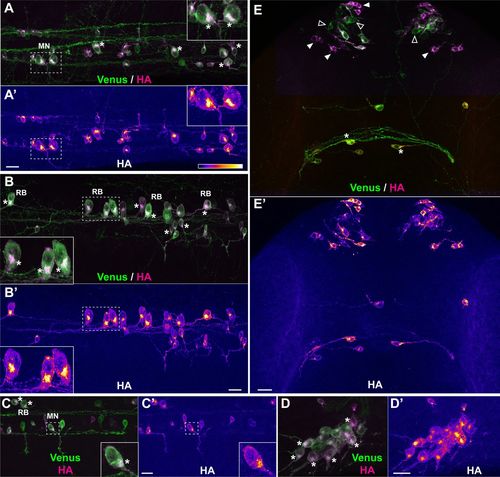
Short treatment with protease inhibitor highlights sites of protein synthesis. Representative examples of protein synthesis patterns revealed by HA/Venus immunostaining of Danoprevir-treated embryos. (A–E) Superimposed Venus (green) and HA (magenta) immunostaining signals. (A′–E′) HA immunostaining signal intensity color-coded with imageJ ‘Fire’ lookup table. Color-intensity correspondence is represented in the calibration bar. (A–C) Lateral views of the trunk region. (D) Dorsal view of the trigeminal ganglion. (E) Dorsal view of the anterior head region. (A,B,E) Transgenic line, Tg(SPoT_tubb5). Danoprevir treatment time, 2 h. (C,D) Transgenic line, Tg(SPoT_chicken ß-actin). Danoprevir treatment time, 1.5 h. Scale bars: 20 µm. Insets represent twofold (A,B) or threefold (C) magnifications of the dashed boxes. Asterisks highlight cells with marked accumulation of newly synthesized protein between the nucleus and axon initial segment. In (E), plain white arrowheads indicate neurons with high newly synthesized SPoT protein, while empty arrowheads indicate neurons which express the SPoT transgene but have not produced SPoT protein during the time of treatment. MN, motor neuron; RB, Rohon-Beard sensory neuron; pc, posterior commissure. |
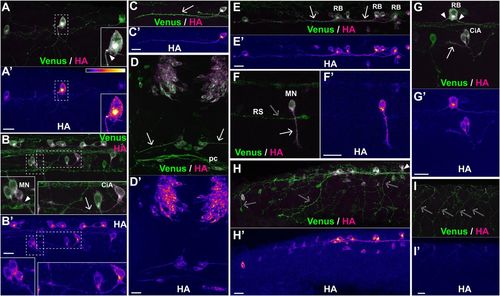
The SPoT reporter reveals translation sites along axons. Representative examples of sites of protein synthesis within axons revealed by HA/Venus immunostaining of Danoprevir-treated embryos. (A–I) Superimposed Venus (green) and HA (magenta) immunostaining signals. (A′–I′) HA immunostaining signal intensity color-coded with imageJ ‘Fire’ lookup table. Color-intensity correspondence is represented in the calibration bar. (A,B,E) Lateral views of the trunk region. (C,H) Lateral views of the tail region. (D) Dorsal view of the anterior head region. (F) Isolated spinal motor neuron; the distal part and growth cone of a large reticulospinal axon is visible, but has no HA staining. (G) Lateral view of isolated RB, motor and inter neurons of the spinal cord. (I) Peripheral arbors of sensory neurons innervating the skin. Note the complete absence of HA signal. Arrowheads mark sites with characteristic accumulation of newly synthesized SPoT reporter in axon initial segment. Arrows point to axons with newly synthesized protein all along the shaft length. Empty arrows point to prominent axons with no protein synthesis. CiA, circumferential ascending neuron; MN, motor neuron; RB, Rohon-Beard neuron; RS, distal portion of a reticulospinal projection. (A,B,D,F,H,I) Transgenic line, Tg(SPoT_chicken ß-actin). Danoprevir treatment time, 1.5 h. (C,E) Transgenic line, Tg(SPoT_tubb5). Danoprevir treatment time, 2 h. (G) Transgenic line, Tg(SPoT_tubb5). Danoprevir treatment time, 40 min. Scale bars: 20 µm. Insets represent twofold magnification of the dashed boxes. |
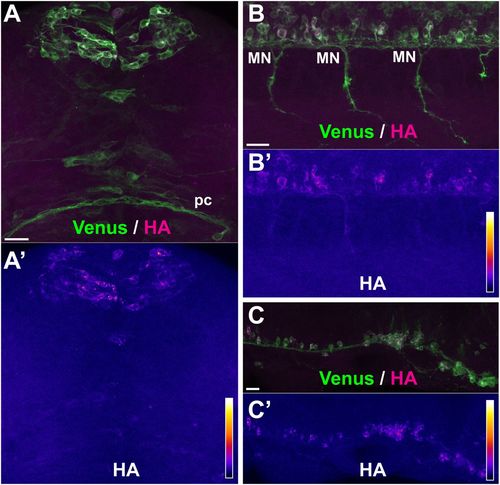
No axonal translation occurs with soma-restricted 3′UTR sequences. Representative examples of sites of protein synthesis revealed by HA/Venus immunostaining of Danoprevir-treated, SPoT transgenic embryos containing 3'UTRs with restricted axonal mRNA localization. (A–C) Superimposed Venus (green) and HA (magenta) immunostaining signals. (A′–C′) HA immunostaining signal intensity color-coded with imageJ ‘Fire’ lookup table. Color-intensity correspondence is represented in the calibration bar. (A,B) Transgenic line, Tg(SPoT_neuroD). Danoprevir treatment time=1.5 h. (C) Transgenic line, Tg(SPoT_chicken ß-actin-ΔZipcode). Danoprevir treatment time, 1.5 h. Scale bars: 20 µm. |