
Fig. 2
- ID
- ZDB-FIG-190328-44
- Publication
- Palha et al., 2018 - An in vivo translation-reporter system for the study of protein synthesis in zebrafish embryos
- Other Figures
- All Figure Page
- Back to All Figure Page
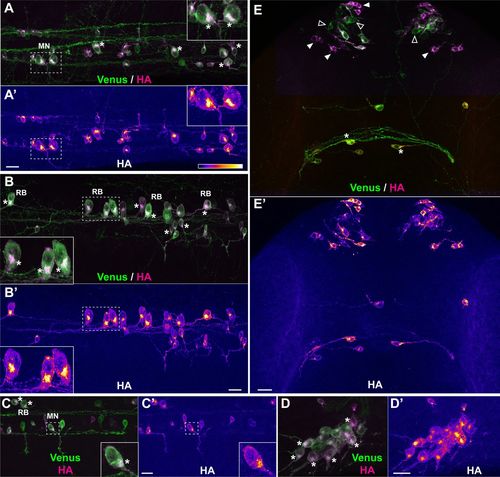
Short treatment with protease inhibitor highlights sites of protein synthesis. Representative examples of protein synthesis patterns revealed by HA/Venus immunostaining of Danoprevir-treated embryos. (A–E) Superimposed Venus (green) and HA (magenta) immunostaining signals. (A′–E′) HA immunostaining signal intensity color-coded with imageJ ‘Fire’ lookup table. Color-intensity correspondence is represented in the calibration bar. (A–C) Lateral views of the trunk region. (D) Dorsal view of the trigeminal ganglion. (E) Dorsal view of the anterior head region. (A,B,E) Transgenic line, Tg(SPoT_tubb5). Danoprevir treatment time, 2 h. (C,D) Transgenic line, Tg(SPoT_chicken ß-actin). Danoprevir treatment time, 1.5 h. Scale bars: 20 µm. Insets represent twofold (A,B) or threefold (C) magnifications of the dashed boxes. Asterisks highlight cells with marked accumulation of newly synthesized protein between the nucleus and axon initial segment. In (E), plain white arrowheads indicate neurons with high newly synthesized SPoT protein, while empty arrowheads indicate neurons which express the SPoT transgene but have not produced SPoT protein during the time of treatment. MN, motor neuron; RB, Rohon-Beard sensory neuron; pc, posterior commissure. |